

due to Volino (1996). Remarkably, the shear elasticity is predicted to be dimensiondependent, which is in agreement with the observations (Derjaguin 1989; Collin
2002; Mendil et al. 2006).
The solid-like property is usually observable at low thickness and is thus hidden
in conventional mechanical measurements since the conventional measurements
are carried out at thicknesses of 1mm or higher (which corrresponds to the
asymptotic branch of the shear elasticity). The sub-millimeter shear elasticity is
however not negligible, reaching several thousands Pascals in polymer melts at
10
2
10
2
10 -2
2
1
0
-1
1
0
-1
0.03
0
0
-0.03
0.003
-0.003
20
1000
-1000
0
5000
-5000
0
10
0
-10
-20
1
0
-1
-2
10
-2
10 -1
10
-1
10
-1
10 1
10
1
10
1
10 3
10
3
10 5 g 0 (%)
g(%)
g(%)
g(%)
g(%)
t(s)
t(s)
t(s)
t(s)
g 0 =0.5%
g 0 =2%
g 0 =10%
g 0 =1000%
g 0 =5000%
g 0 =5000%
10
-4
10 0
b
a
10
0
10
2
10
1
10
0
10
0
G ′ G′′(Pa)
G′, G′′(Pa)
G′′(Pa)
ω(rad/s)
ω(rad/s)
Solid-like behaviour:
s(a.u.)/g
0
s(a.u.)/g
0
s(a.u.)/g
0
s(a.u.)/g
0
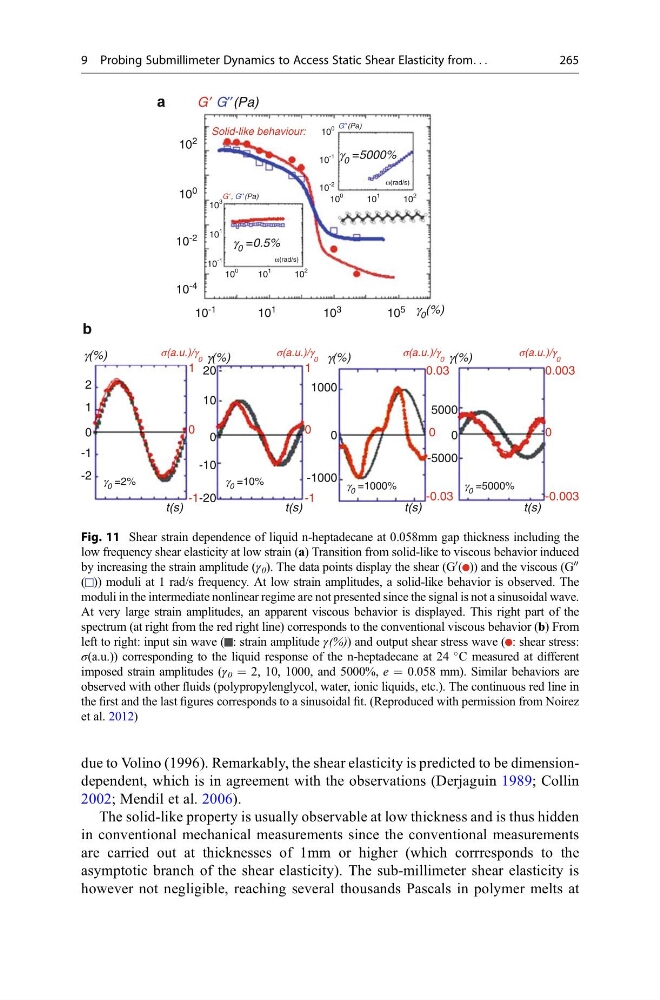
Fig. 11 Shear strain dependence of liquid n-heptadecane at 0.058mm gap thickness including the
low frequency shear elasticity at low strain (a) Transition from solid-like to viscous behavior induced
by increasing the strain amplitude (γ 0 ). The data points display the shear (G
0 ( )) and the viscous (G
00
( )) moduli at 1 rad/s frequency. At low strain amplitudes, a solid-like behavior is observed. The
moduli in the intermediate nonlinear regime are not presented since the signal is not a sinusoidal wave.
At very large strain amplitudes, an apparent viscous behavior is displayed. This right part of the
spectrum (at right from the red right line) corresponds to the conventional viscous behavior (b) From
left to right: input sin wave ( : strain amplitude γ(%)) and output shear stress wave ( : shear stress:
σ(a.u.)) corresponding to the liquid response of the n-heptadecane at 24
C measured at different
imposed strain amplitudes (γ 0 = 2, 10, 1000, and 5000%, e = 0.058 mm). Similar behaviors are
observed with other fluids (polypropylenglycol, water, ionic liquids, etc.). The continuous red line in
the first and the last figures corresponds to a sinusoidal fit. (Reproduced with permission from Noirez
et al. 2012)
9 Probing Submillimeter Dynamics to Access Static Shear Elasticity from. . .
265
2002; Mendil et al. 2006).
The solid-like property is usually observable at low thickness and is thus hidden
in conventional mechanical measurements since the conventional measurements
are carried out at thicknesses of 1mm or higher (which corrresponds to the
asymptotic branch of the shear elasticity). The sub-millimeter shear elasticity is
however not negligible, reaching several thousands Pascals in polymer melts at
10
2
10
2
10 -2
2
1
0
-1
1
0
-1
0.03
0
0
-0.03
0.003
-0.003
20
1000
-1000
0
5000
-5000
0
10
0
-10
-20
1
0
-1
-2
10
-2
10 -1
10
-1
10
-1
10 1
10
1
10
1
10 3
10
3
10 5 g 0 (%)
g(%)
g(%)
g(%)
g(%)
t(s)
t(s)
t(s)
t(s)
g 0 =0.5%
g 0 =2%
g 0 =10%
g 0 =1000%
g 0 =5000%
g 0 =5000%
10
-4
10 0
b
a
10
0
10
2
10
1
10
0
10
0
G ′ G′′(Pa)
G′, G′′(Pa)
G′′(Pa)
ω(rad/s)
ω(rad/s)
Solid-like behaviour:
s(a.u.)/g
0
s(a.u.)/g
0
s(a.u.)/g
0
s(a.u.)/g
0
Fig. 11 Shear strain dependence of liquid n-heptadecane at 0.058mm gap thickness including the
low frequency shear elasticity at low strain (a) Transition from solid-like to viscous behavior induced
by increasing the strain amplitude (γ 0 ). The data points display the shear (G
0 ( )) and the viscous (G
00
( )) moduli at 1 rad/s frequency. At low strain amplitudes, a solid-like behavior is observed. The
moduli in the intermediate nonlinear regime are not presented since the signal is not a sinusoidal wave.
At very large strain amplitudes, an apparent viscous behavior is displayed. This right part of the
spectrum (at right from the red right line) corresponds to the conventional viscous behavior (b) From
left to right: input sin wave ( : strain amplitude γ(%)) and output shear stress wave ( : shear stress:
σ(a.u.)) corresponding to the liquid response of the n-heptadecane at 24
C measured at different
imposed strain amplitudes (γ 0 = 2, 10, 1000, and 5000%, e = 0.058 mm). Similar behaviors are
observed with other fluids (polypropylenglycol, water, ionic liquids, etc.). The continuous red line in
the first and the last figures corresponds to a sinusoidal fit. (Reproduced with permission from Noirez
et al. 2012)
9 Probing Submillimeter Dynamics to Access Static Shear Elasticity from. . .
265