

between adjacent Pys via H-bonding. The Miller indices close to the beam stop are
shown in the magnified 2D image at the bottom of the figure. At 120
C, the 2D
XRD pattern changed and could be fitted with a monoclinic unit cell with
a = 8.03 nm, b = 5.50 nm, c = 0.49 nm, and γ = 95
. The corresponding 2D
XRD pattern in Fig. 16b showed reflections on both the equator and the first layer
line, where the (151) and (581) reflections started to appear in the quadrant. At
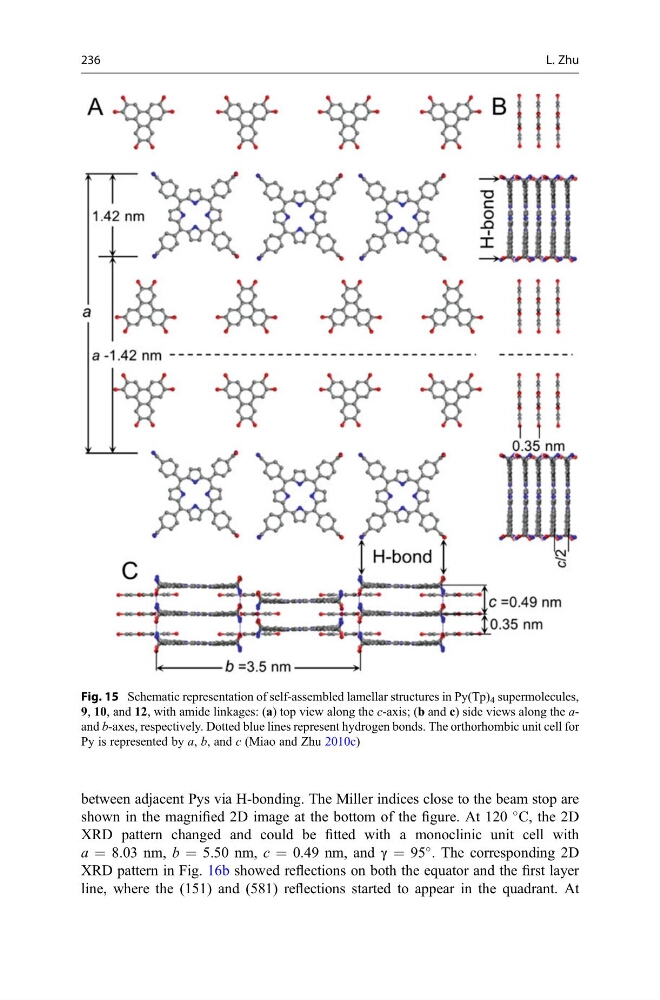
Fig. 15 Schematic representation of self-assembled lamellar structures in Py(Tp) 4 supermolecules,
9, 10, and 12, with amide linkages: (a) top view along the c-axis; (b and c) side views along the aand b-axes, respectively. Dotted blue lines represent hydrogen bonds. The orthorhombic unit cell for
Py is represented by a, b, and c (Miao and Zhu 2010c)
236
L. Zhu
shown in the magnified 2D image at the bottom of the figure. At 120
C, the 2D
XRD pattern changed and could be fitted with a monoclinic unit cell with
a = 8.03 nm, b = 5.50 nm, c = 0.49 nm, and γ = 95
. The corresponding 2D
XRD pattern in Fig. 16b showed reflections on both the equator and the first layer
line, where the (151) and (581) reflections started to appear in the quadrant. At
Fig. 15 Schematic representation of self-assembled lamellar structures in Py(Tp) 4 supermolecules,
9, 10, and 12, with amide linkages: (a) top view along the c-axis; (b and c) side views along the aand b-axes, respectively. Dotted blue lines represent hydrogen bonds. The orthorhombic unit cell for
Py is represented by a, b, and c (Miao and Zhu 2010c)
236
L. Zhu