

the π-π stacking (or the column) direction conformed to the shear direction for
columnar liquid crystals (note that shearing was performed in the liquid crystalline
phase at 164
C). Obviously, the amide I and the N–H absorption bands at 1640 and
3300 cm
À1 were the strongest when the angle was 0
and the weakest when the angle
was 90
, suggesting that the hydrogen bonds were along the π-π stacking
(or column) direction. Similar results were also observed for samples 9, 10, and 12.
Based on the DSC results (Fig. 10 and Table 3), samples 9, 10, and 12 should
have a crystalline phase at room temperature. To solve their structures, 2D XRD
experiments were performed on shear-oriented samples and the shear temperatures
were chosen at a few to 20
C below the T m . All the 2D XRD patterns in Fig. 14
can be explained by an orthorhombic symmetry, and the assigned Miller indices are
also shown in Fig. 14. Judging from the distinct (100), (200) (extinct for samples
10 and 12), and (300) reflections in the 2D XRD patterns, a lamellar microstructure
must be formed in the bulk samples. The unit cell dimensions are determined as:
a = 4.82 nm, b = 3.50 nm, and c = 0.49 nm for sample 9.
a = 4.89 nm, b = 3.50 nm, and c = 0.49 nm for sample 10.
a = 5.78 nm, b = 3.50 nm, and c = 0.49 nm for sample 12.
However, the outermost reflection with a d-spacing of 0.35 nm located in between
the first and second layers of the [00l]-uniaxial XRD patterns for samples 9 and 10 in
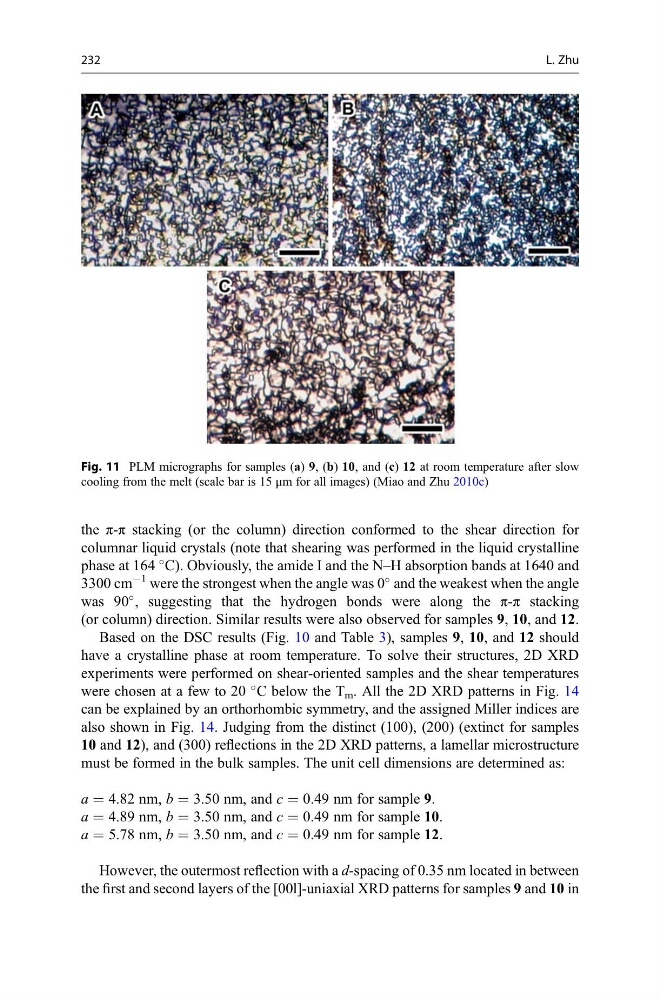
Fig. 11 PLM micrographs for samples (a) 9, (b) 10, and (c) 12 at room temperature after slow
cooling from the melt (scale bar is 15 μm for all images) (Miao and Zhu 2010c)
232
L. Zhu
columnar liquid crystals (note that shearing was performed in the liquid crystalline
phase at 164
C). Obviously, the amide I and the N–H absorption bands at 1640 and
3300 cm
À1 were the strongest when the angle was 0
and the weakest when the angle
was 90
, suggesting that the hydrogen bonds were along the π-π stacking
(or column) direction. Similar results were also observed for samples 9, 10, and 12.
Based on the DSC results (Fig. 10 and Table 3), samples 9, 10, and 12 should
have a crystalline phase at room temperature. To solve their structures, 2D XRD
experiments were performed on shear-oriented samples and the shear temperatures
were chosen at a few to 20
C below the T m . All the 2D XRD patterns in Fig. 14
can be explained by an orthorhombic symmetry, and the assigned Miller indices are
also shown in Fig. 14. Judging from the distinct (100), (200) (extinct for samples
10 and 12), and (300) reflections in the 2D XRD patterns, a lamellar microstructure
must be formed in the bulk samples. The unit cell dimensions are determined as:
a = 4.82 nm, b = 3.50 nm, and c = 0.49 nm for sample 9.
a = 4.89 nm, b = 3.50 nm, and c = 0.49 nm for sample 10.
a = 5.78 nm, b = 3.50 nm, and c = 0.49 nm for sample 12.
However, the outermost reflection with a d-spacing of 0.35 nm located in between
the first and second layers of the [00l]-uniaxial XRD patterns for samples 9 and 10 in
Fig. 11 PLM micrographs for samples (a) 9, (b) 10, and (c) 12 at room temperature after slow
cooling from the melt (scale bar is 15 μm for all images) (Miao and Zhu 2010c)
232
L. Zhu