

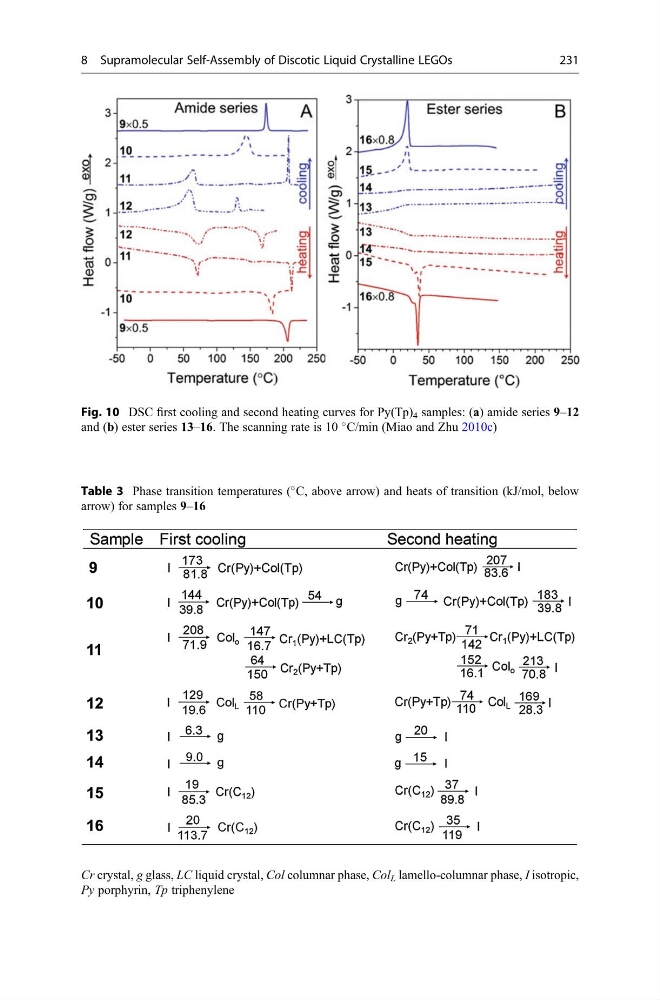
Fig. 10 DSC first cooling and second heating curves for Py(Tp) 4 samples: (a) amide series 9–12
and (b) ester series 13–16. The scanning rate is 10
C/min (Miao and Zhu 2010c)
Table 3 Phase transition temperatures (
C, above arrow) and heats of transition (kJ/mol, below
arrow) for samples 9–16
Cr crystal, g glass, LC liquid crystal, Col columnar phase, Col L lamello-columnar phase, I isotropic,
Py porphyrin, Tp triphenylene
8 Supramolecular Self-Assembly of Discotic Liquid Crystalline LEGOs
231
and (b) ester series 13–16. The scanning rate is 10
C/min (Miao and Zhu 2010c)
Table 3 Phase transition temperatures (
C, above arrow) and heats of transition (kJ/mol, below
arrow) for samples 9–16
Cr crystal, g glass, LC liquid crystal, Col columnar phase, Col L lamello-columnar phase, I isotropic,
Py porphyrin, Tp triphenylene
8 Supramolecular Self-Assembly of Discotic Liquid Crystalline LEGOs
231