

234
9
4. Dynamic Mechanical Analysis (DMA)—DMA provides the
viscoelastic response of the samples. It is a technique that is
widely used to characterize a material’s properties as a function
of temperature, time, frequency, stress, and atmosphere or a
combination of these parameters. In DMA, a sinusoidal
deformation through a controlled stress or a controlled strain
is applied to a sample of known geometry. The sample deforms
under this controlled stress or strain. The stiffness and damping of the sample are measured, and these are reported as the
modulus and the tan delta, respectively. Due to the application
of a sinusoidal force, the modulus is expressed as an in-phase
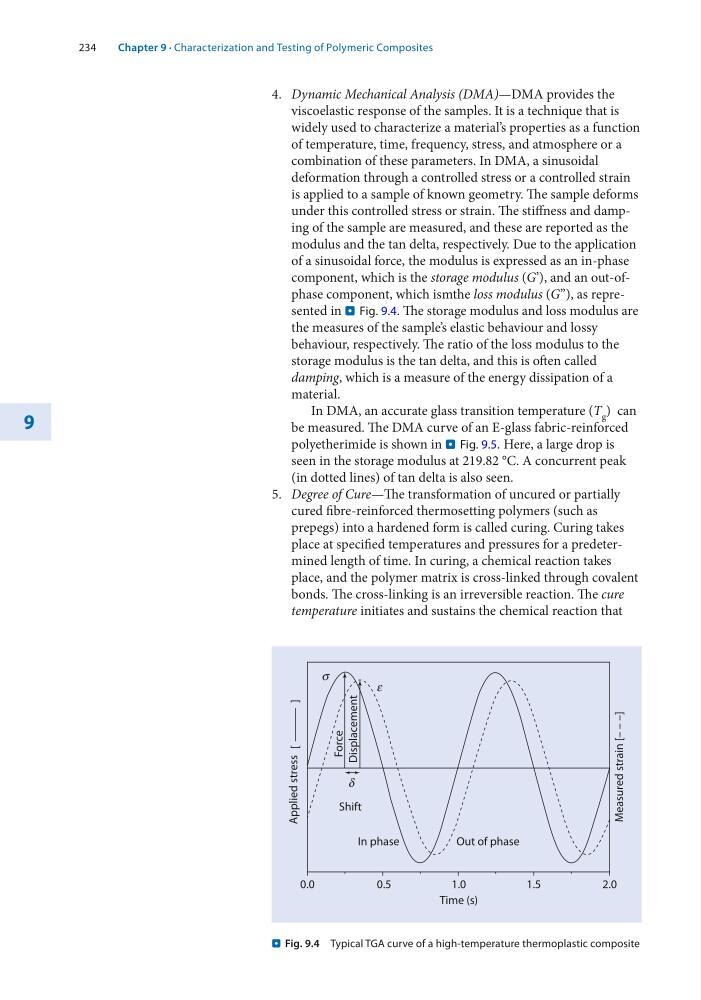
component, which is the storage modulus (G’), and an out-ofphase component, which ismthe loss modulus (G”), as represented in . Fig. 9.4. The storage modulus and loss modulus are
the measures of the sample’s elastic behaviour and lossy
behaviour, respectively. The ratio of the loss modulus to the
storage modulus is the tan delta, and this is often called
damping, which is a measure of the energy dissipation of a
material.
In DMA, an accurate glass transition temperature (T g ) can
be measured. The DMA curve of an E-glass fabric-reinforced
polyetherimide is shown in . Fig. 9.5. Here, a large drop is
seen in the storage modulus at 219.82 °C. A concurrent peak
(in dotted lines) of tan delta is also seen.
5. Degree of Cure—The transformation of uncured or partially
cured fibre-reinforced thermosetting polymers (such as
prepegs) into a hardened form is called curing. Curing takes
place at specified temperatures and pressures for a predetermined length of time. In curing, a chemical reaction takes
place, and the polymer matrix is cross-linked through covalent
bonds. The cross-linking is an irreversible reaction. The cure
temperature initiates and sustains the chemical reaction that
0.0
0.5
In phase
Shift
d
Force
Displacement
Out of phase
Time (s)
Applied stress
Measured strain [– – –]
1.0
1.5
2.0
[
]
s
e
. Fig. 9.4 Typical TGA curve of a high-temperature thermoplastic composite
Chapter 9 · Characterization and Testing of Polymeric Composites
9
4. Dynamic Mechanical Analysis (DMA)—DMA provides the
viscoelastic response of the samples. It is a technique that is
widely used to characterize a material’s properties as a function
of temperature, time, frequency, stress, and atmosphere or a
combination of these parameters. In DMA, a sinusoidal
deformation through a controlled stress or a controlled strain
is applied to a sample of known geometry. The sample deforms
under this controlled stress or strain. The stiffness and damping of the sample are measured, and these are reported as the
modulus and the tan delta, respectively. Due to the application
of a sinusoidal force, the modulus is expressed as an in-phase
component, which is the storage modulus (G’), and an out-ofphase component, which ismthe loss modulus (G”), as represented in . Fig. 9.4. The storage modulus and loss modulus are
the measures of the sample’s elastic behaviour and lossy
behaviour, respectively. The ratio of the loss modulus to the
storage modulus is the tan delta, and this is often called
damping, which is a measure of the energy dissipation of a
material.
In DMA, an accurate glass transition temperature (T g ) can
be measured. The DMA curve of an E-glass fabric-reinforced
polyetherimide is shown in . Fig. 9.5. Here, a large drop is
seen in the storage modulus at 219.82 °C. A concurrent peak
(in dotted lines) of tan delta is also seen.
5. Degree of Cure—The transformation of uncured or partially
cured fibre-reinforced thermosetting polymers (such as
prepegs) into a hardened form is called curing. Curing takes
place at specified temperatures and pressures for a predetermined length of time. In curing, a chemical reaction takes
place, and the polymer matrix is cross-linked through covalent
bonds. The cross-linking is an irreversible reaction. The cure
temperature initiates and sustains the chemical reaction that
0.0
0.5
In phase
Shift
d
Force
Displacement
Out of phase
Time (s)
Applied stress
Measured strain [– – –]
1.0
1.5
2.0
[
]
s
e
. Fig. 9.4 Typical TGA curve of a high-temperature thermoplastic composite
Chapter 9 · Characterization and Testing of Polymeric Composites