

233
9
recorded in the form of peaks caused due to the temperature
difference. The temperature difference is recorded in the form
of peaks with reference to the temperature in the DTA thermogram. The samples are usually prepared in the weight range of
5–7 mg. The test may be carried out from −170 °C to as high as
2400 °C [3, 6, 7].
3. Thermogravimetric Analysis (TGA)—TGA is carried out to
learn the response of the sample in terms of weight loss with
respect to temperature. The weight loss occurs due to thermal
degradation. The weight loss is measured under an inert or
oxidative environment as needed. TGA is carried out as per
ASTM D3418. The samples are prepared in the weight range of
5–7 mg. The test is carried out up to 850 °C. The results are
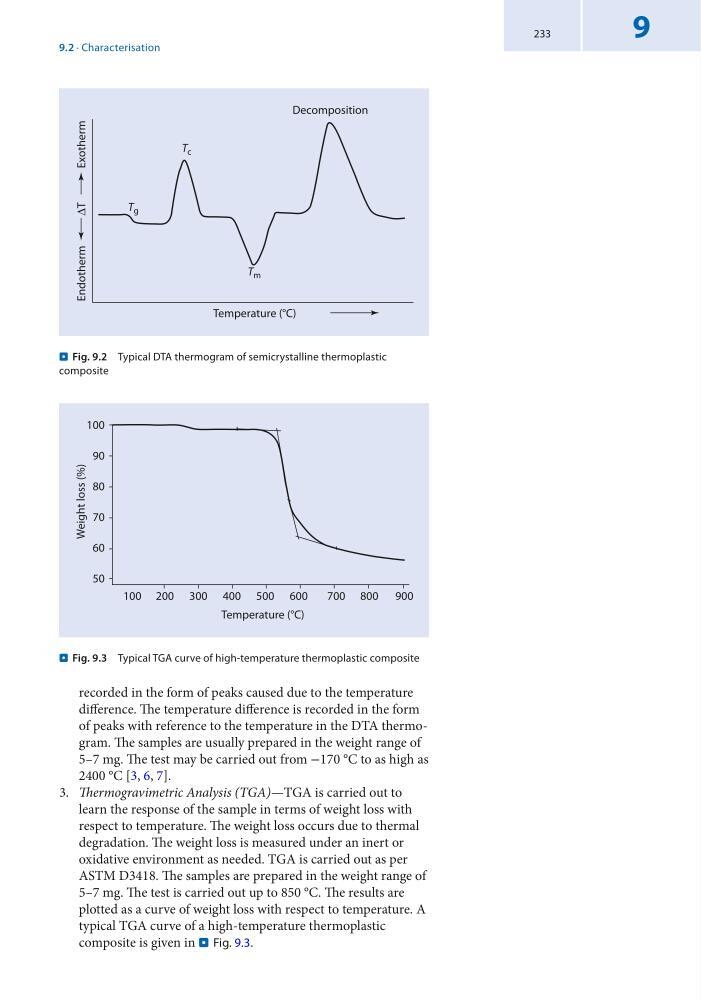
plotted as a curve of weight loss with respect to temperature. A
typical TGA curve of a high-temperature thermoplastic
composite is given in . Fig. 9.3.
Temperature (°C)
Decomposition
T m
T g
T c
Endotherm
E xotherm
∆T
. Fig. 9.2 Typical DTA thermogram of semicrystalline thermoplastic
composite
Temperature (°C)
Weight loss (%)
100
50
60
70
80
90
100
200 300 400 500 600
700 800 900
. Fig. 9.3 Typical TGA curve of high-temperature thermoplastic composite
9.2 · Characterisation
9
recorded in the form of peaks caused due to the temperature
difference. The temperature difference is recorded in the form
of peaks with reference to the temperature in the DTA thermogram. The samples are usually prepared in the weight range of
5–7 mg. The test may be carried out from −170 °C to as high as
2400 °C [3, 6, 7].
3. Thermogravimetric Analysis (TGA)—TGA is carried out to
learn the response of the sample in terms of weight loss with
respect to temperature. The weight loss occurs due to thermal
degradation. The weight loss is measured under an inert or
oxidative environment as needed. TGA is carried out as per
ASTM D3418. The samples are prepared in the weight range of
5–7 mg. The test is carried out up to 850 °C. The results are
plotted as a curve of weight loss with respect to temperature. A
typical TGA curve of a high-temperature thermoplastic
composite is given in . Fig. 9.3.
Temperature (°C)
Decomposition
T m
T g
T c
Endotherm
E xotherm
∆T
. Fig. 9.2 Typical DTA thermogram of semicrystalline thermoplastic
composite
Temperature (°C)
Weight loss (%)
100
50
60
70
80
90
100
200 300 400 500 600
700 800 900
. Fig. 9.3 Typical TGA curve of high-temperature thermoplastic composite
9.2 · Characterisation