

126
5
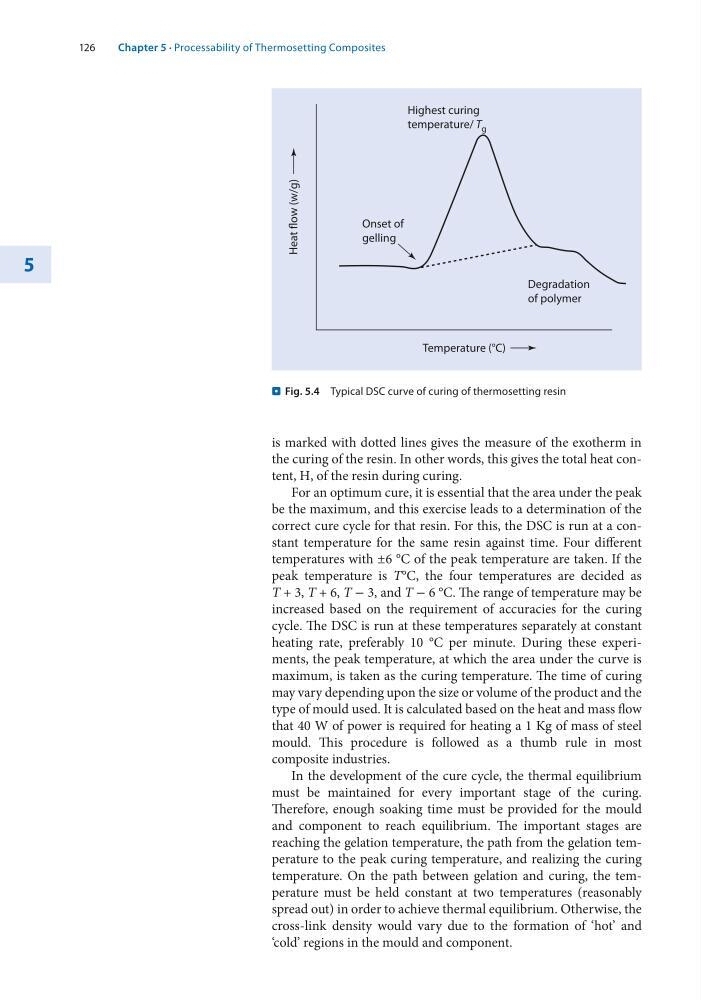
is marked with dotted lines gives the measure of the exotherm in
the curing of the resin. In other words, this gives the total heat content, H, of the resin during curing.
For an optimum cure, it is essential that the area under the peak
be the maximum, and this exercise leads to a determination of the
correct cure cycle for that resin. For this, the DSC is run at a constant temperature for the same resin against time. Four different
temperatures with ±6 °C of the peak temperature are taken. If the
peak temperature is T°C, the four temperatures are decided as
T + 3, T + 6, T − 3, and T − 6 °C. The range of temperature may be
increased based on the requirement of accuracies for the curing
cycle. The DSC is run at these temperatures separately at constant
heating rate, preferably 10 °C per minute. During these experiments, the peak temperature, at which the area under the curve is
maximum, is taken as the curing temperature. The time of curing
may vary depending upon the size or volume of the product and the
type of mould used. It is calculated based on the heat and mass flow
that 40 W of power is required for heating a 1 Kg of mass of steel
mould. This procedure is followed as a thumb rule in most
composite industries.
In the development of the cure cycle, the thermal equilibrium
must be maintained for every important stage of the curing.
Therefore, enough soaking time must be provided for the mould
and component to reach equilibrium. The important stages are
reaching the gelation temperature, the path from the gelation temperature to the peak curing temperature, and realizing the curing
temperature. On the path between gelation and curing, the temperature must be held constant at two temperatures (reasonably
spread out) in order to achieve thermal equilibrium. Otherwise, the
cross-link density would vary due to the formation of ‘hot’ and
‘cold’ regions in the mould and component.
Onset of
gelling
Degradation
of polymer
Highest curing
temperature/ T g
Temperature (°C)
Heat flow (w/g)
. Fig. 5.4 Typical DSC curve of curing of thermosetting resin
Chapter 5 · Processability of Thermosetting Composites
5
is marked with dotted lines gives the measure of the exotherm in
the curing of the resin. In other words, this gives the total heat content, H, of the resin during curing.
For an optimum cure, it is essential that the area under the peak
be the maximum, and this exercise leads to a determination of the
correct cure cycle for that resin. For this, the DSC is run at a constant temperature for the same resin against time. Four different
temperatures with ±6 °C of the peak temperature are taken. If the
peak temperature is T°C, the four temperatures are decided as
T + 3, T + 6, T − 3, and T − 6 °C. The range of temperature may be
increased based on the requirement of accuracies for the curing
cycle. The DSC is run at these temperatures separately at constant
heating rate, preferably 10 °C per minute. During these experiments, the peak temperature, at which the area under the curve is
maximum, is taken as the curing temperature. The time of curing
may vary depending upon the size or volume of the product and the
type of mould used. It is calculated based on the heat and mass flow
that 40 W of power is required for heating a 1 Kg of mass of steel
mould. This procedure is followed as a thumb rule in most
composite industries.
In the development of the cure cycle, the thermal equilibrium
must be maintained for every important stage of the curing.
Therefore, enough soaking time must be provided for the mould
and component to reach equilibrium. The important stages are
reaching the gelation temperature, the path from the gelation temperature to the peak curing temperature, and realizing the curing
temperature. On the path between gelation and curing, the temperature must be held constant at two temperatures (reasonably
spread out) in order to achieve thermal equilibrium. Otherwise, the
cross-link density would vary due to the formation of ‘hot’ and
‘cold’ regions in the mould and component.
Onset of
gelling
Degradation
of polymer
Highest curing
temperature/ T g
Temperature (°C)
Heat flow (w/g)
. Fig. 5.4 Typical DSC curve of curing of thermosetting resin
Chapter 5 · Processability of Thermosetting Composites