

worth to point out that the deviation from linearity does not affect the slope of the
long-time asymptote, i.e. the estimation of the diffusional time constant, which falls
in the Henry’s law region [11], and as a result, the shift of the long-time asymptote of
the partial loading experiment should be predicted accurately by the standard model,
as is the case in the examples considered. The fact that the partial loading experiments show a more accurate match to the standard model is consistent with the
limited uptake during the short exposure time to the sorbate. In the partial loading
experiments, the adsorbed phase concentration remains low at all times and therefore
either in the linear region or close to it.
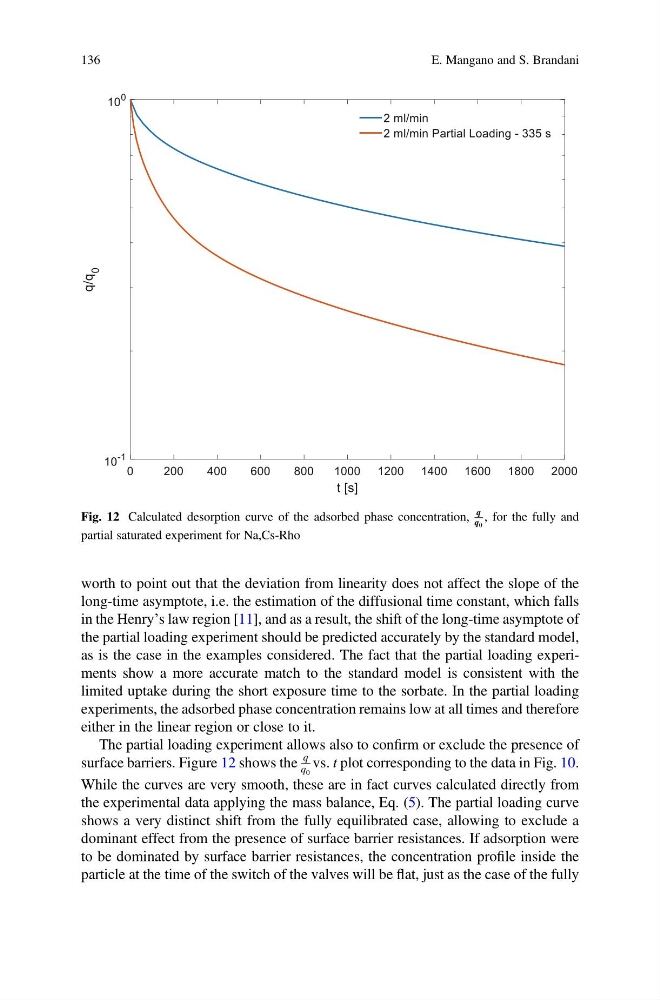
The partial loading experiment allows also to confirm or exclude the presence of
surface barriers. Figure 12 shows the
q
q 0
vs. t plot corresponding to the data in Fig. 10.
While the curves are very smooth, these are in fact curves calculated directly from
the experimental data applying the mass balance, Eq. (5). The partial loading curve
shows a very distinct shift from the fully equilibrated case, allowing to exclude a
dominant effect from the presence of surface barrier resistances. If adsorption were
to be dominated by surface barrier resistances, the concentration profile inside the
particle at the time of the switch of the valves will be flat, just as the case of the fully
Fig. 12 Calculated desorption curve of the adsorbed phase concentration,
q
q 0
, for the fully and
partial saturated experiment for Na,Cs-Rho
136
E. Mangano and S. Brandani
long-time asymptote, i.e. the estimation of the diffusional time constant, which falls
in the Henry’s law region [11], and as a result, the shift of the long-time asymptote of
the partial loading experiment should be predicted accurately by the standard model,
as is the case in the examples considered. The fact that the partial loading experiments show a more accurate match to the standard model is consistent with the
limited uptake during the short exposure time to the sorbate. In the partial loading
experiments, the adsorbed phase concentration remains low at all times and therefore
either in the linear region or close to it.
The partial loading experiment allows also to confirm or exclude the presence of
surface barriers. Figure 12 shows the
q
q 0
vs. t plot corresponding to the data in Fig. 10.
While the curves are very smooth, these are in fact curves calculated directly from
the experimental data applying the mass balance, Eq. (5). The partial loading curve
shows a very distinct shift from the fully equilibrated case, allowing to exclude a
dominant effect from the presence of surface barrier resistances. If adsorption were
to be dominated by surface barrier resistances, the concentration profile inside the
particle at the time of the switch of the valves will be flat, just as the case of the fully
Fig. 12 Calculated desorption curve of the adsorbed phase concentration,
q
q 0
, for the fully and
partial saturated experiment for Na,Cs-Rho
136
E. Mangano and S. Brandani