

the experimental one. Using the parameters from the longer observation time,
instead, provides an excellent prediction of both the partially and fully equilibrated
experiment. This confirms that the process is governed by a single time constant,
excluding a significant contribution from the effect of particle size distributions or
other processes.
It is important to emphasise that “goodness of fit” alone does not provide an
assurance that the correct time constant has been obtained, unless both different
flowrates and partial loading experiments are considered.
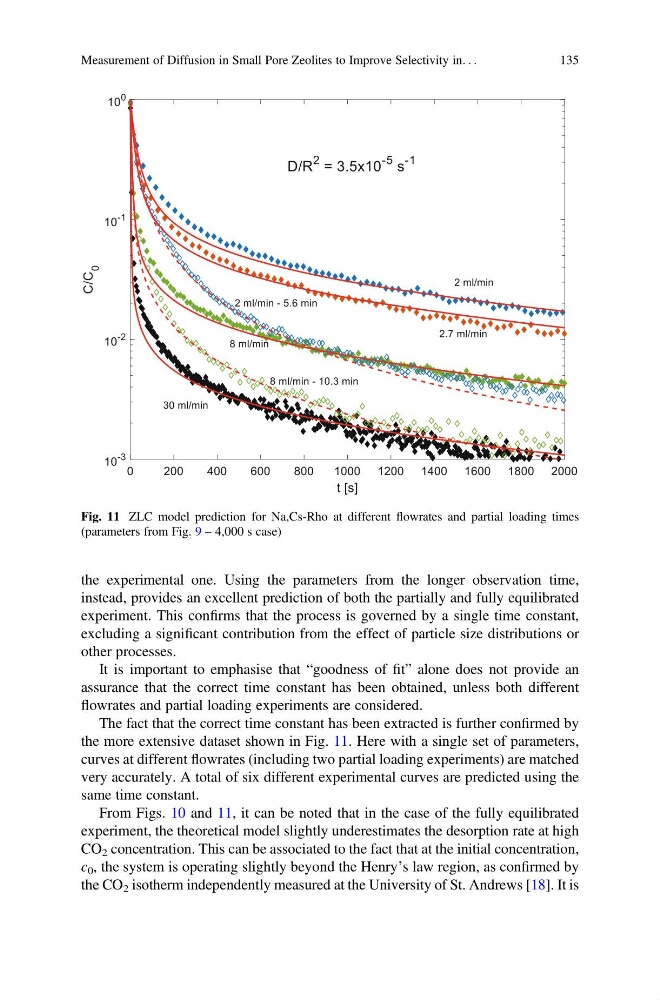
The fact that the correct time constant has been extracted is further confirmed by
the more extensive dataset shown in Fig. 11. Here with a single set of parameters,
curves at different flowrates (including two partial loading experiments) are matched
very accurately. A total of six different experimental curves are predicted using the
same time constant.
From Figs. 10 and 11, it can be noted that in the case of the fully equilibrated
experiment, the theoretical model slightly underestimates the desorption rate at high
CO 2 concentration. This can be associated to the fact that at the initial concentration,
c 0 , the system is operating slightly beyond the Henry’s law region, as confirmed by
the CO 2 isotherm independently measured at the University of St. Andrews [18]. It is
Fig. 11 ZLC model prediction for Na,Cs-Rho at different flowrates and partial loading times
(parameters from Fig. 9 – 4,000 s case)
Measurement of Diffusion in Small Pore Zeolites to Improve Selectivity in. . .
135
instead, provides an excellent prediction of both the partially and fully equilibrated
experiment. This confirms that the process is governed by a single time constant,
excluding a significant contribution from the effect of particle size distributions or
other processes.
It is important to emphasise that “goodness of fit” alone does not provide an
assurance that the correct time constant has been obtained, unless both different
flowrates and partial loading experiments are considered.
The fact that the correct time constant has been extracted is further confirmed by
the more extensive dataset shown in Fig. 11. Here with a single set of parameters,
curves at different flowrates (including two partial loading experiments) are matched
very accurately. A total of six different experimental curves are predicted using the
same time constant.
From Figs. 10 and 11, it can be noted that in the case of the fully equilibrated
experiment, the theoretical model slightly underestimates the desorption rate at high
CO 2 concentration. This can be associated to the fact that at the initial concentration,
c 0 , the system is operating slightly beyond the Henry’s law region, as confirmed by
the CO 2 isotherm independently measured at the University of St. Andrews [18]. It is
Fig. 11 ZLC model prediction for Na,Cs-Rho at different flowrates and partial loading times
(parameters from Fig. 9 – 4,000 s case)
Measurement of Diffusion in Small Pore Zeolites to Improve Selectivity in. . .
135