

equilibrated case; therefore the curves would overlap in the
q
q 0
plot [9]. The time
constant obtained is therefore a diffusivity inside the crystals.
Fully exchanged Na-Rho has a similar cation distribution as the Na,Cs Rho
(Fig. 7). Therefore, a similar behaviour in terms of gas transport is expected.
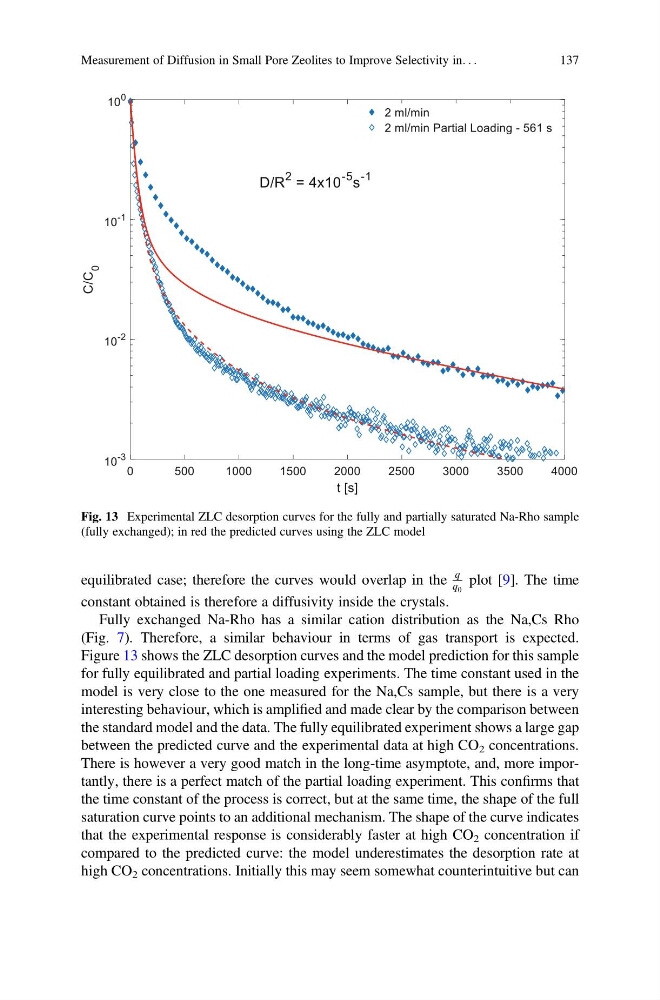
Figure 13 shows the ZLC desorption curves and the model prediction for this sample
for fully equilibrated and partial loading experiments. The time constant used in the
model is very close to the one measured for the Na,Cs sample, but there is a very
interesting behaviour, which is amplified and made clear by the comparison between
the standard model and the data. The fully equilibrated experiment shows a large gap
between the predicted curve and the experimental data at high CO 2 concentrations.
There is however a very good match in the long-time asymptote, and, more importantly, there is a perfect match of the partial loading experiment. This confirms that
the time constant of the process is correct, but at the same time, the shape of the full
saturation curve points to an additional mechanism. The shape of the curve indicates
that the experimental response is considerably faster at high CO 2 concentration if
compared to the predicted curve: the model underestimates the desorption rate at
high CO 2 concentrations. Initially this may seem somewhat counterintuitive but can
Fig. 13 Experimental ZLC desorption curves for the fully and partially saturated Na-Rho sample
(fully exchanged); in red the predicted curves using the ZLC model
Measurement of Diffusion in Small Pore Zeolites to Improve Selectivity in. . .
137
q
q 0
plot [9]. The time
constant obtained is therefore a diffusivity inside the crystals.
Fully exchanged Na-Rho has a similar cation distribution as the Na,Cs Rho
(Fig. 7). Therefore, a similar behaviour in terms of gas transport is expected.
Figure 13 shows the ZLC desorption curves and the model prediction for this sample
for fully equilibrated and partial loading experiments. The time constant used in the
model is very close to the one measured for the Na,Cs sample, but there is a very
interesting behaviour, which is amplified and made clear by the comparison between
the standard model and the data. The fully equilibrated experiment shows a large gap
between the predicted curve and the experimental data at high CO 2 concentrations.
There is however a very good match in the long-time asymptote, and, more importantly, there is a perfect match of the partial loading experiment. This confirms that
the time constant of the process is correct, but at the same time, the shape of the full
saturation curve points to an additional mechanism. The shape of the curve indicates
that the experimental response is considerably faster at high CO 2 concentration if
compared to the predicted curve: the model underestimates the desorption rate at
high CO 2 concentrations. Initially this may seem somewhat counterintuitive but can
Fig. 13 Experimental ZLC desorption curves for the fully and partially saturated Na-Rho sample
(fully exchanged); in red the predicted curves using the ZLC model
Measurement of Diffusion in Small Pore Zeolites to Improve Selectivity in. . .
137