

most used methods/models to calculate V μP include DR, t-plot, α S -plot, and DFT,
each method presenting different assumptions, physical criteria, or application
ranges. In the case of the DR method, it must be applied within p/p
o range where
the micropores are being filled, whereas t-plot and α S -plot methods must be applied
from the point where the micropores have been fully filled. Besides, to apply the last
two methods correctly, it is necessary to use a non-porous reference material with
similar chemical nature to that of the analyzed porous material.
In general, for zeolites, which are mainly microporous, the micropore volume,
V μP , can be calculated with the DR method due to its simplicity (only requiring the
use of one equation). However, when zeolites present mesoporosity, DR method
overestimates V μP which increases with the mesoporosity degree of the material
[32]. In this case, it is necessary to use the other methods mentioned above, where,
for zeolites, it is advisable to use the Harkins and Jura equation [43, 44] for t-plot
method and LiChrospher Si-1000 macroporous silica [44, 45] as reference for α S -
plot method. It is worthy of highlighting that both last methods, t-plot and α S -plot,
also provide information about the external surface area, S EXT , which is related to the
area where the mono-multilayer formation takes place (outside the micropores).
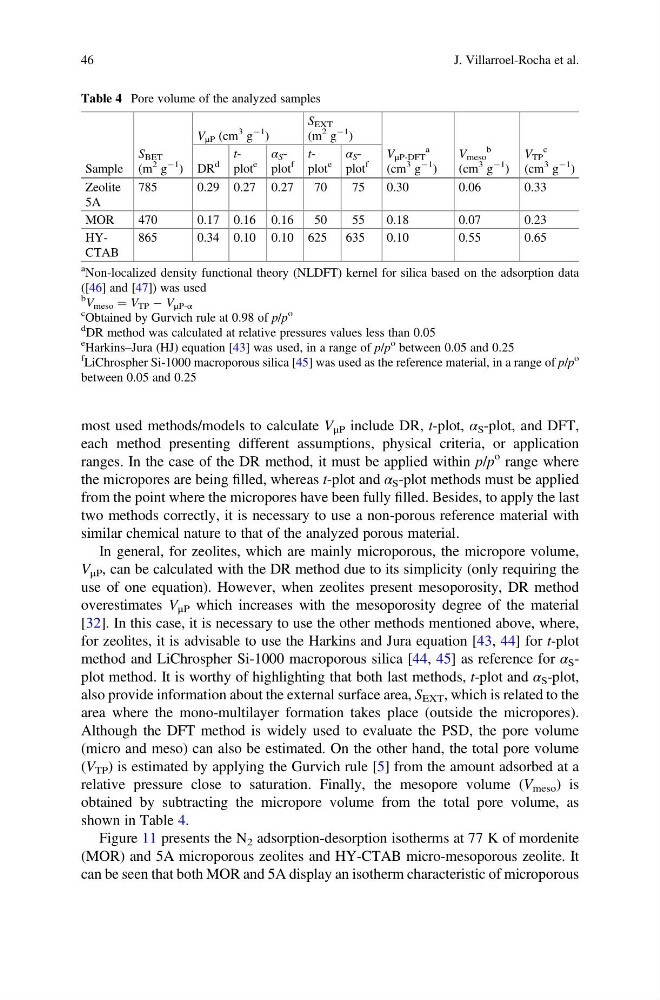
Although the DFT method is widely used to evaluate the PSD, the pore volume
(micro and meso) can also be estimated. On the other hand, the total pore volume
(V TP ) is estimated by applying the Gurvich rule [5] from the amount adsorbed at a
relative pressure close to saturation. Finally, the mesopore volume (V meso ) is
obtained by subtracting the micropore volume from the total pore volume, as
shown in Table 4.
Figure 11 presents the N 2 adsorption-desorption isotherms at 77 K of mordenite
(MOR) and 5A microporous zeolites and HY-CTAB micro-mesoporous zeolite. It
can be seen that both MOR and 5A display an isotherm characteristic of microporous
Table 4 Pore volume of the analyzed samples
Sample
S BET
(m
2 g
À1
)
V μP (cm
3 g
À1
)
S EXT
(m
2 g
À1
)
V μP-DFT
a
(cm
3 g
À1
)
V meso
b
(cm
3 g
À1
)
V TP
c
(cm
3 g
À1
)
DR
d
tplot
e
α S -
plot
f
tplot
e
α S -
plot
f
Zeolite
5A
785
0.29 0.27 0.27
70
75
0.30
0.06
0.33
MOR
470
0.17 0.16 0.16
50
55
0.18
0.07
0.23
HYCTAB
865
0.34 0.10 0.10 625 635
0.10
0.55
0.65
a Non-localized density functional theory (NLDFT) kernel for silica based on the adsorption data
([46] and [47]) was used
b
V meso ¼ V TP À V μP-α
c Obtained by Gurvich rule at 0.98 of p/p
o
d
DR method was calculated at relative pressures values less than 0.05
e Harkins–Jura (HJ) equation [43] was used, in a range of p/p
o between 0.05 and 0.25
f
LiChrospher Si-1000 macroporous silica [45] was used as the reference material, in a range of p/p
o
between 0.05 and 0.25
46
J. Villarroel-Rocha et al.
each method presenting different assumptions, physical criteria, or application
ranges. In the case of the DR method, it must be applied within p/p
o range where
the micropores are being filled, whereas t-plot and α S -plot methods must be applied
from the point where the micropores have been fully filled. Besides, to apply the last
two methods correctly, it is necessary to use a non-porous reference material with
similar chemical nature to that of the analyzed porous material.
In general, for zeolites, which are mainly microporous, the micropore volume,
V μP , can be calculated with the DR method due to its simplicity (only requiring the
use of one equation). However, when zeolites present mesoporosity, DR method
overestimates V μP which increases with the mesoporosity degree of the material
[32]. In this case, it is necessary to use the other methods mentioned above, where,
for zeolites, it is advisable to use the Harkins and Jura equation [43, 44] for t-plot
method and LiChrospher Si-1000 macroporous silica [44, 45] as reference for α S -
plot method. It is worthy of highlighting that both last methods, t-plot and α S -plot,
also provide information about the external surface area, S EXT , which is related to the
area where the mono-multilayer formation takes place (outside the micropores).
Although the DFT method is widely used to evaluate the PSD, the pore volume
(micro and meso) can also be estimated. On the other hand, the total pore volume
(V TP ) is estimated by applying the Gurvich rule [5] from the amount adsorbed at a
relative pressure close to saturation. Finally, the mesopore volume (V meso ) is
obtained by subtracting the micropore volume from the total pore volume, as
shown in Table 4.
Figure 11 presents the N 2 adsorption-desorption isotherms at 77 K of mordenite
(MOR) and 5A microporous zeolites and HY-CTAB micro-mesoporous zeolite. It
can be seen that both MOR and 5A display an isotherm characteristic of microporous
Table 4 Pore volume of the analyzed samples
Sample
S BET
(m
2 g
À1
)
V μP (cm
3 g
À1
)
S EXT
(m
2 g
À1
)
V μP-DFT
a
(cm
3 g
À1
)
V meso
b
(cm
3 g
À1
)
V TP
c
(cm
3 g
À1
)
DR
d
tplot
e
α S -
plot
f
tplot
e
α S -
plot
f
Zeolite
5A
785
0.29 0.27 0.27
70
75
0.30
0.06
0.33
MOR
470
0.17 0.16 0.16
50
55
0.18
0.07
0.23
HYCTAB
865
0.34 0.10 0.10 625 635
0.10
0.55
0.65
a Non-localized density functional theory (NLDFT) kernel for silica based on the adsorption data
([46] and [47]) was used
b
V meso ¼ V TP À V μP-α
c Obtained by Gurvich rule at 0.98 of p/p
o
d
DR method was calculated at relative pressures values less than 0.05
e Harkins–Jura (HJ) equation [43] was used, in a range of p/p
o between 0.05 and 0.25
f
LiChrospher Si-1000 macroporous silica [45] was used as the reference material, in a range of p/p
o
between 0.05 and 0.25
46
J. Villarroel-Rocha et al.