

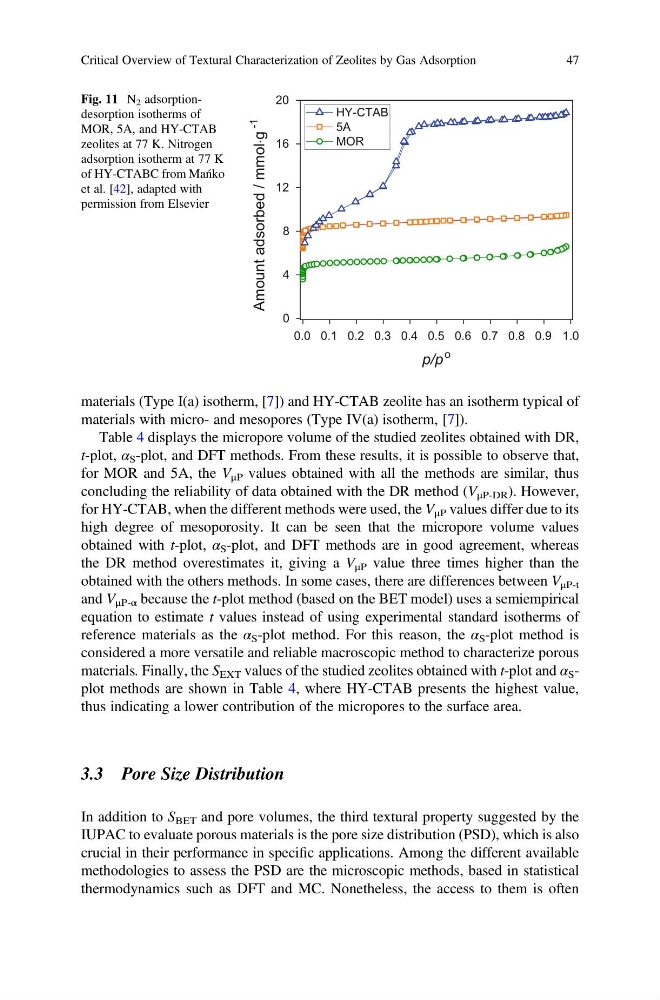
materials (Type I(a) isotherm, [7]) and HY-CTAB zeolite has an isotherm typical of
materials with micro- and mesopores (Type IV(a) isotherm, [7]).
Table 4 displays the micropore volume of the studied zeolites obtained with DR,
t-plot, α S -plot, and DFT methods. From these results, it is possible to observe that,
for MOR and 5A, the V μP values obtained with all the methods are similar, thus
concluding the reliability of data obtained with the DR method (V μP-DR ). However,
for HY-CTAB, when the different methods were used, the V μP values differ due to its
high degree of mesoporosity. It can be seen that the micropore volume values
obtained with t-plot, α S -plot, and DFT methods are in good agreement, whereas
the DR method overestimates it, giving a V μP value three times higher than the
obtained with the others methods. In some cases, there are differences between V μP-t
and V μP-α because the t-plot method (based on the BET model) uses a semiempirical
equation to estimate t values instead of using experimental standard isotherms of
reference materials as the α S -plot method. For this reason, the α S -plot method is
considered a more versatile and reliable macroscopic method to characterize porous
materials. Finally, the S EXT values of the studied zeolites obtained with t-plot and α S -
plot methods are shown in Table 4, where HY-CTAB presents the highest value,
thus indicating a lower contribution of the micropores to the surface area.
3.3 Pore Size Distribution
In addition to S BET and pore volumes, the third textural property suggested by the
IUPAC to evaluate porous materials is the pore size distribution (PSD), which is also
crucial in their performance in specific applications. Among the different available
methodologies to assess the PSD are the microscopic methods, based in statistical
thermodynamics such as DFT and MC. Nonetheless, the access to them is often
0.0 0.1 0.2 0.3 0.4 0.5 0.6 0.7 0.8 0.9 1.0
0
4
8
12
16
20
Amount adsorbed / mmol⋅g
-1
p/p
o
HY-CTAB
5A
MOR
Fig. 11 N 2 adsorptiondesorption isotherms of
MOR, 5A, and HY-CTAB
zeolites at 77 K. Nitrogen
adsorption isotherm at 77 K
of HY-CTABC from Mańko
et al. [42], adapted with
permission from Elsevier
Critical Overview of Textural Characterization of Zeolites by Gas Adsorption
47
materials with micro- and mesopores (Type IV(a) isotherm, [7]).
Table 4 displays the micropore volume of the studied zeolites obtained with DR,
t-plot, α S -plot, and DFT methods. From these results, it is possible to observe that,
for MOR and 5A, the V μP values obtained with all the methods are similar, thus
concluding the reliability of data obtained with the DR method (V μP-DR ). However,
for HY-CTAB, when the different methods were used, the V μP values differ due to its
high degree of mesoporosity. It can be seen that the micropore volume values
obtained with t-plot, α S -plot, and DFT methods are in good agreement, whereas
the DR method overestimates it, giving a V μP value three times higher than the
obtained with the others methods. In some cases, there are differences between V μP-t
and V μP-α because the t-plot method (based on the BET model) uses a semiempirical
equation to estimate t values instead of using experimental standard isotherms of
reference materials as the α S -plot method. For this reason, the α S -plot method is
considered a more versatile and reliable macroscopic method to characterize porous
materials. Finally, the S EXT values of the studied zeolites obtained with t-plot and α S -
plot methods are shown in Table 4, where HY-CTAB presents the highest value,
thus indicating a lower contribution of the micropores to the surface area.
3.3 Pore Size Distribution
In addition to S BET and pore volumes, the third textural property suggested by the
IUPAC to evaluate porous materials is the pore size distribution (PSD), which is also
crucial in their performance in specific applications. Among the different available
methodologies to assess the PSD are the microscopic methods, based in statistical
thermodynamics such as DFT and MC. Nonetheless, the access to them is often
0.0 0.1 0.2 0.3 0.4 0.5 0.6 0.7 0.8 0.9 1.0
0
4
8
12
16
20
Amount adsorbed / mmol⋅g
-1
p/p
o
HY-CTAB
5A
MOR
Fig. 11 N 2 adsorptiondesorption isotherms of
MOR, 5A, and HY-CTAB
zeolites at 77 K. Nitrogen
adsorption isotherm at 77 K
of HY-CTABC from Mańko
et al. [42], adapted with
permission from Elsevier
Critical Overview of Textural Characterization of Zeolites by Gas Adsorption
47