

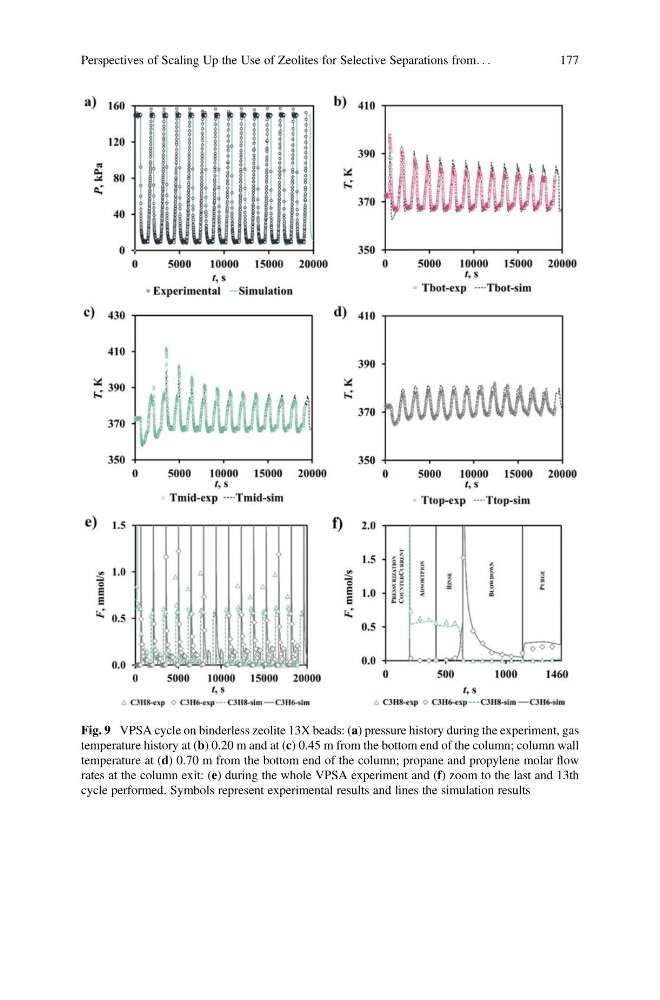
Fig. 9 VPSA cycle on binderless zeolite 13X beads: (a) pressure history during the experiment, gas
temperature history at (b) 0.20 m and at (c) 0.45 m from the bottom end of the column; column wall
temperature at (d) 0.70 m from the bottom end of the column; propane and propylene molar flow
rates at the column exit: (e) during the whole VPSA experiment and (f) zoom to the last and 13th
cycle performed. Symbols represent experimental results and lines the simulation results
Perspectives of Scaling Up the Use of Zeolites for Selective Separations from. . .
177
temperature history at (b) 0.20 m and at (c) 0.45 m from the bottom end of the column; column wall
temperature at (d) 0.70 m from the bottom end of the column; propane and propylene molar flow
rates at the column exit: (e) during the whole VPSA experiment and (f) zoom to the last and 13th
cycle performed. Symbols represent experimental results and lines the simulation results
Perspectives of Scaling Up the Use of Zeolites for Selective Separations from. . .
177