

This model is a straightforward model, easy to implement, and describes several
systems under study quite accurately, being therefore so interesting for the use in
modeling.
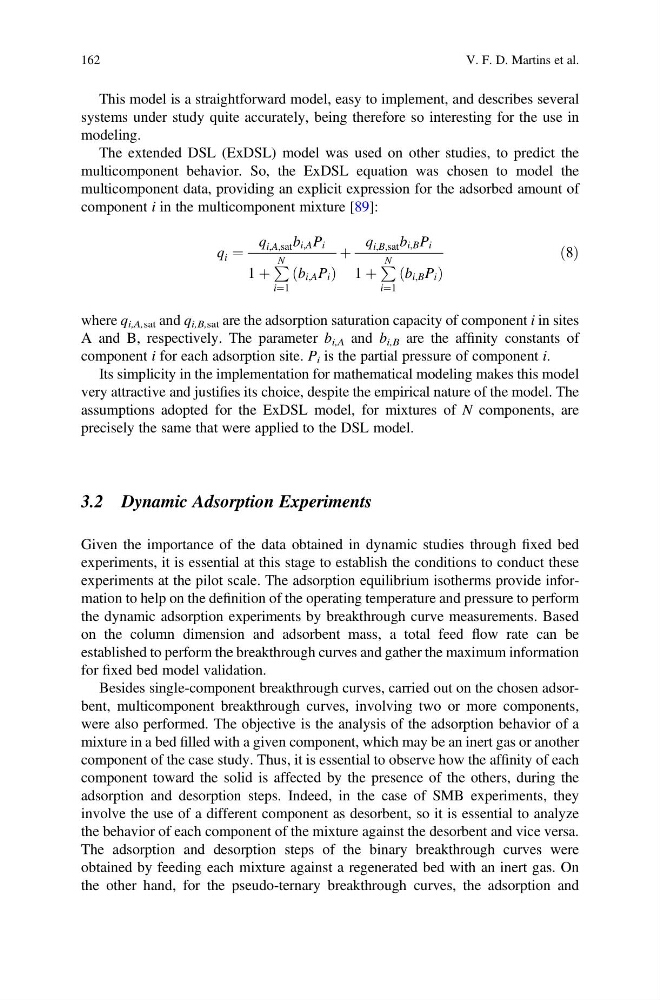
The extended DSL (ExDSL) model was used on other studies, to predict the
multicomponent behavior. So, the ExDSL equation was chosen to model the
multicomponent data, providing an explicit expression for the adsorbed amount of
component i in the multicomponent mixture [89]:
q i ¼
q i,A,sat b i,A P i
1 þ
P N
i¼1
b i,A P i
ð
Þ
þ
q i,B,sat b i,B P i
1 þ
P N
i¼1
b i,B P i
ð
Þ
ð8Þ
where q i,A,sat and q i,B,sat are the adsorption saturation capacity of component i in sites
A and B, respectively. The parameter b i,A and b i,B are the affinity constants of
component i for each adsorption site. P i is the partial pressure of component i.
Its simplicity in the implementation for mathematical modeling makes this model
very attractive and justifies its choice, despite the empirical nature of the model. The
assumptions adopted for the ExDSL model, for mixtures of N components, are
precisely the same that were applied to the DSL model.
3.2 Dynamic Adsorption Experiments
Given the importance of the data obtained in dynamic studies through fixed bed
experiments, it is essential at this stage to establish the conditions to conduct these
experiments at the pilot scale. The adsorption equilibrium isotherms provide information to help on the definition of the operating temperature and pressure to perform
the dynamic adsorption experiments by breakthrough curve measurements. Based
on the column dimension and adsorbent mass, a total feed flow rate can be
established to perform the breakthrough curves and gather the maximum information
for fixed bed model validation.
Besides single-component breakthrough curves, carried out on the chosen adsorbent, multicomponent breakthrough curves, involving two or more components,
were also performed. The objective is the analysis of the adsorption behavior of a
mixture in a bed filled with a given component, which may be an inert gas or another
component of the case study. Thus, it is essential to observe how the affinity of each
component toward the solid is affected by the presence of the others, during the
adsorption and desorption steps. Indeed, in the case of SMB experiments, they
involve the use of a different component as desorbent, so it is essential to analyze
the behavior of each component of the mixture against the desorbent and vice versa.
The adsorption and desorption steps of the binary breakthrough curves were
obtained by feeding each mixture against a regenerated bed with an inert gas. On
the other hand, for the pseudo-ternary breakthrough curves, the adsorption and
162
V. F. D. Martins et al.
systems under study quite accurately, being therefore so interesting for the use in
modeling.
The extended DSL (ExDSL) model was used on other studies, to predict the
multicomponent behavior. So, the ExDSL equation was chosen to model the
multicomponent data, providing an explicit expression for the adsorbed amount of
component i in the multicomponent mixture [89]:
q i ¼
q i,A,sat b i,A P i
1 þ
P N
i¼1
b i,A P i
ð
Þ
þ
q i,B,sat b i,B P i
1 þ
P N
i¼1
b i,B P i
ð
Þ
ð8Þ
where q i,A,sat and q i,B,sat are the adsorption saturation capacity of component i in sites
A and B, respectively. The parameter b i,A and b i,B are the affinity constants of
component i for each adsorption site. P i is the partial pressure of component i.
Its simplicity in the implementation for mathematical modeling makes this model
very attractive and justifies its choice, despite the empirical nature of the model. The
assumptions adopted for the ExDSL model, for mixtures of N components, are
precisely the same that were applied to the DSL model.
3.2 Dynamic Adsorption Experiments
Given the importance of the data obtained in dynamic studies through fixed bed
experiments, it is essential at this stage to establish the conditions to conduct these
experiments at the pilot scale. The adsorption equilibrium isotherms provide information to help on the definition of the operating temperature and pressure to perform
the dynamic adsorption experiments by breakthrough curve measurements. Based
on the column dimension and adsorbent mass, a total feed flow rate can be
established to perform the breakthrough curves and gather the maximum information
for fixed bed model validation.
Besides single-component breakthrough curves, carried out on the chosen adsorbent, multicomponent breakthrough curves, involving two or more components,
were also performed. The objective is the analysis of the adsorption behavior of a
mixture in a bed filled with a given component, which may be an inert gas or another
component of the case study. Thus, it is essential to observe how the affinity of each
component toward the solid is affected by the presence of the others, during the
adsorption and desorption steps. Indeed, in the case of SMB experiments, they
involve the use of a different component as desorbent, so it is essential to analyze
the behavior of each component of the mixture against the desorbent and vice versa.
The adsorption and desorption steps of the binary breakthrough curves were
obtained by feeding each mixture against a regenerated bed with an inert gas. On
the other hand, for the pseudo-ternary breakthrough curves, the adsorption and
162
V. F. D. Martins et al.