

69
subsea oil spills are those describing the ascent of spherical bubbles and of somewhat larger ellipsoidal bubbles with internal circulations, respectively. The former
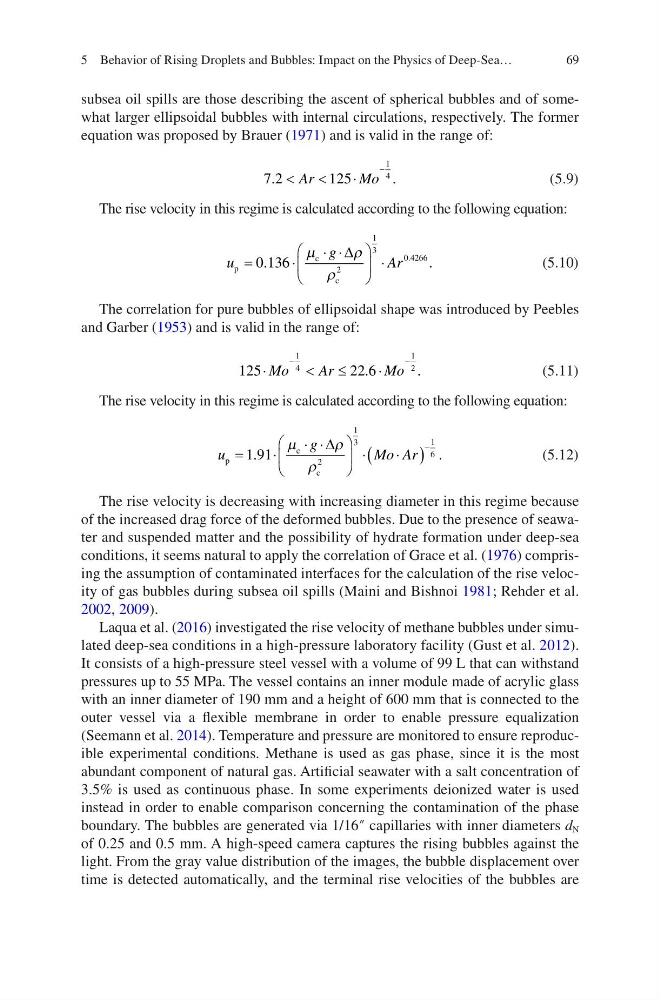
equation was proposed by Brauer (1971) and is valid in the range of:
7 2
125
1
4
. <
<
⋅
−
Ar
Mo .
(5.9)
The rise velocity in this regime is calculated according to the following equation:
u
g
Ar
p
c
c
.
=
⋅
⋅ ⋅
⋅
0 136
2
1
3
0 4266
.
.
µ
ρ
ρ
∆
(5.10)
The correlation for pure bubbles of ellipsoidal shape was introduced by Peebles
and Garber (1953) and is valid in the range of:
125
22 6
1
4
1
2
⋅
<
≤
⋅
−
−
Mo
Ar
Mo
.
.
(5.11)
The rise velocity in this regime is calculated according to the following equation:
u
g
Mo Ar
p
c
c
.
=
⋅
⋅ ⋅
⋅
⋅
(
)
−
1 91
2
1
3
1
6
.
µ
ρ
ρ
∆
(5.12)
The rise velocity is decreasing with increasing diameter in this regime because
of the increased drag force of the deformed bubbles. Due to the presence of seawater and suspended matter and the possibility of hydrate formation under deep-sea
conditions, it seems natural to apply the correlation of Grace et al. (1976) comprising the assumption of contaminated interfaces for the calculation of the rise velocity of gas bubbles during subsea oil spills (Maini and Bishnoi 1981; Rehder et al.
2002, 2009).
Laqua et al. (2016) investigated the rise velocity of methane bubbles under simulated deep-sea conditions in a high-pressure laboratory facility (Gust et al. 2012).
It consists of a high-pressure steel vessel with a volume of 99 L that can withstand
pressures up to 55 MPa. The vessel contains an inner module made of acrylic glass
with an inner diameter of 190 mm and a height of 600 mm that is connected to the
outer vessel via a flexible membrane in order to enable pressure equalization
(Seemann et al. 2014). Temperature and pressure are monitored to ensure reproducible experimental conditions. Methane is used as gas phase, since it is the most
abundant component of natural gas. Artificial seawater with a salt concentration of
3.5% is used as continuous phase. In some experiments deionized water is used
instead in order to enable comparison concerning the contamination of the phase
boundary. The bubbles are generated via 1/16″ capillaries with inner diameters d N
of 0.25 and 0.5 mm. A high-speed camera captures the rising bubbles against the
light. From the gray value distribution of the images, the bubble displacement over
time is detected automatically, and the terminal rise velocities of the bubbles are
5 Behavior of Rising Droplets and Bubbles: Impact on the Physics of Deep-Sea…
subsea oil spills are those describing the ascent of spherical bubbles and of somewhat larger ellipsoidal bubbles with internal circulations, respectively. The former
equation was proposed by Brauer (1971) and is valid in the range of:
7 2
125
1
4
. <
<
⋅
−
Ar
Mo .
(5.9)
The rise velocity in this regime is calculated according to the following equation:
u
g
Ar
p
c
c
.
=
⋅
⋅ ⋅
⋅
0 136
2
1
3
0 4266
.
.
µ
ρ
ρ
∆
(5.10)
The correlation for pure bubbles of ellipsoidal shape was introduced by Peebles
and Garber (1953) and is valid in the range of:
125
22 6
1
4
1
2
⋅
<
≤
⋅
−
−
Mo
Ar
Mo
.
.
(5.11)
The rise velocity in this regime is calculated according to the following equation:
u
g
Mo Ar
p
c
c
.
=
⋅
⋅ ⋅
⋅
⋅
(
)
−
1 91
2
1
3
1
6
.
µ
ρ
ρ
∆
(5.12)
The rise velocity is decreasing with increasing diameter in this regime because
of the increased drag force of the deformed bubbles. Due to the presence of seawater and suspended matter and the possibility of hydrate formation under deep-sea
conditions, it seems natural to apply the correlation of Grace et al. (1976) comprising the assumption of contaminated interfaces for the calculation of the rise velocity of gas bubbles during subsea oil spills (Maini and Bishnoi 1981; Rehder et al.
2002, 2009).
Laqua et al. (2016) investigated the rise velocity of methane bubbles under simulated deep-sea conditions in a high-pressure laboratory facility (Gust et al. 2012).
It consists of a high-pressure steel vessel with a volume of 99 L that can withstand
pressures up to 55 MPa. The vessel contains an inner module made of acrylic glass
with an inner diameter of 190 mm and a height of 600 mm that is connected to the
outer vessel via a flexible membrane in order to enable pressure equalization
(Seemann et al. 2014). Temperature and pressure are monitored to ensure reproducible experimental conditions. Methane is used as gas phase, since it is the most
abundant component of natural gas. Artificial seawater with a salt concentration of
3.5% is used as continuous phase. In some experiments deionized water is used
instead in order to enable comparison concerning the contamination of the phase
boundary. The bubbles are generated via 1/16″ capillaries with inner diameters d N
of 0.25 and 0.5 mm. A high-speed camera captures the rising bubbles against the
light. From the gray value distribution of the images, the bubble displacement over
time is detected automatically, and the terminal rise velocities of the bubbles are
5 Behavior of Rising Droplets and Bubbles: Impact on the Physics of Deep-Sea…