

70
calculated using a custom-made Java script. Experiments have been carried out for
absolute pressures of 0.1 and 15.1 MPa, temperatures of 4 and 20 °C, and artificial
seawater and deionized water.
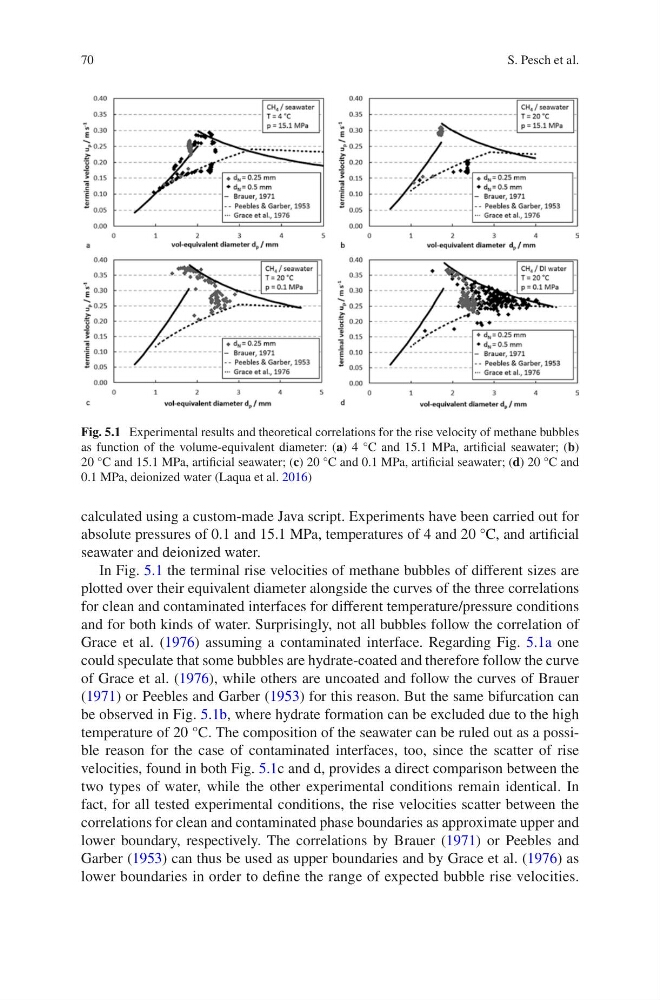
In Fig. 5.1 the terminal rise velocities of methane bubbles of different sizes are
plotted over their equivalent diameter alongside the curves of the three correlations
for clean and contaminated interfaces for different temperature/pressure conditions
and for both kinds of water. Surprisingly, not all bubbles follow the correlation of
Grace et al. (1976) assuming a contaminated interface. Regarding Fig. 5.1a one
could speculate that some bubbles are hydrate-coated and therefore follow the curve
of Grace et al. (1976), while others are uncoated and follow the curves of Brauer
(1971) or Peebles and Garber (1953) for this reason. But the same bifurcation can
be observed in Fig. 5.1b, where hydrate formation can be excluded due to the high
temperature of 20 °C. The composition of the seawater can be ruled out as a possible reason for the case of contaminated interfaces, too, since the scatter of rise
velocities, found in both Fig. 5.1c and d, provides a direct comparison between the
two types of water, while the other experimental conditions remain identical. In
fact, for all tested experimental conditions, the rise velocities scatter between the
correlations for clean and contaminated phase boundaries as approximate upper and
lower boundary, respectively. The correlations by Brauer (1971) or Peebles and
Garber (1953) can thus be used as upper boundaries and by Grace et al. (1976) as
lower boundaries in order to define the range of expected bubble rise velocities.
Fig. 5.1 Experimental results and theoretical correlations for the rise velocity of methane bubbles
as function of the volume-equivalent diameter: (a) 4 °C and 15.1 MPa, artificial seawater; (b)
20 °C and 15.1 MPa, artificial seawater; (c) 20 °C and 0.1 MPa, artificial seawater; (d) 20 °C and
0.1 MPa, deionized water (Laqua et al. 2016)
S. Pesch et al.
calculated using a custom-made Java script. Experiments have been carried out for
absolute pressures of 0.1 and 15.1 MPa, temperatures of 4 and 20 °C, and artificial
seawater and deionized water.
In Fig. 5.1 the terminal rise velocities of methane bubbles of different sizes are
plotted over their equivalent diameter alongside the curves of the three correlations
for clean and contaminated interfaces for different temperature/pressure conditions
and for both kinds of water. Surprisingly, not all bubbles follow the correlation of
Grace et al. (1976) assuming a contaminated interface. Regarding Fig. 5.1a one
could speculate that some bubbles are hydrate-coated and therefore follow the curve
of Grace et al. (1976), while others are uncoated and follow the curves of Brauer
(1971) or Peebles and Garber (1953) for this reason. But the same bifurcation can
be observed in Fig. 5.1b, where hydrate formation can be excluded due to the high
temperature of 20 °C. The composition of the seawater can be ruled out as a possible reason for the case of contaminated interfaces, too, since the scatter of rise
velocities, found in both Fig. 5.1c and d, provides a direct comparison between the
two types of water, while the other experimental conditions remain identical. In
fact, for all tested experimental conditions, the rise velocities scatter between the
correlations for clean and contaminated phase boundaries as approximate upper and
lower boundary, respectively. The correlations by Brauer (1971) or Peebles and
Garber (1953) can thus be used as upper boundaries and by Grace et al. (1976) as
lower boundaries in order to define the range of expected bubble rise velocities.
Fig. 5.1 Experimental results and theoretical correlations for the rise velocity of methane bubbles
as function of the volume-equivalent diameter: (a) 4 °C and 15.1 MPa, artificial seawater; (b)
20 °C and 15.1 MPa, artificial seawater; (c) 20 °C and 0.1 MPa, artificial seawater; (d) 20 °C and
0.1 MPa, deionized water (Laqua et al. 2016)
S. Pesch et al.