

578
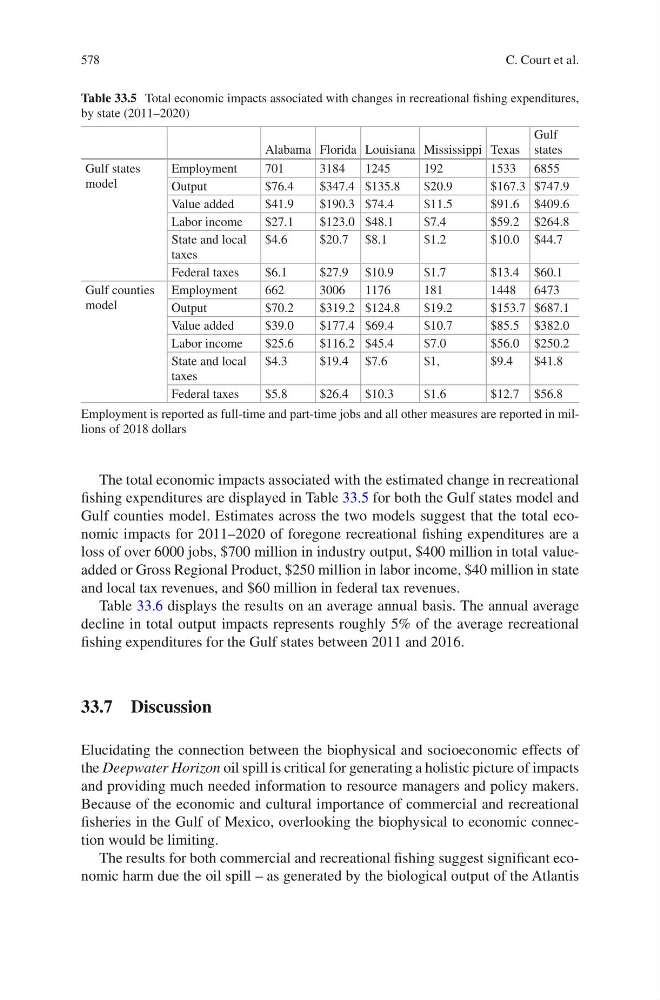
The total economic impacts associated with the estimated change in recreational
fishing expenditures are displayed in Table 33.5 for both the Gulf states model and
Gulf counties model. Estimates across the two models suggest that the total economic impacts for 2011–2020 of foregone recreational fishing expenditures are a
loss of over 6000 jobs, $700 million in industry output, $400 million in total valueadded or Gross Regional Product, $250 million in labor income, $40 million in state
and local tax revenues, and $60 million in federal tax revenues.
Table 33.6 displays the results on an average annual basis. The annual average
decline in total output impacts represents roughly 5% of the average recreational
fishing expenditures for the Gulf states between 2011 and 2016.
33.7 Discussion
Elucidating the connection between the biophysical and socioeconomic effects of
the Deepwater Horizon oil spill is critical for generating a holistic picture of impacts
and providing much needed information to resource managers and policy makers.
Because of the economic and cultural importance of commercial and recreational
fisheries in the Gulf of Mexico, overlooking the biophysical to economic connection would be limiting.
The results for both commercial and recreational fishing suggest significant economic harm due the oil spill – as generated by the biological output of the Atlantis
Table 33.5 Total economic impacts associated with changes in recreational fishing expenditures,
by state (2011–2020)
Alabama Florida Louisiana Mississippi Texas
Gulf
states
Gulf states
model
Employment
701
3184
1245
192
1533 6855
Output
$76.4
$347.4 $135.8
$20.9
$167.3 $747.9
Value added
$41.9
$190.3 $74.4
$11.5
$91.6 $409.6
Labor income
$27.1
$123.0 $48.1
$7.4
$59.2 $264.8
State and local
taxes
$4.6
$20.7 $8.1
$1.2
$10.0 $44.7
Federal taxes
$6.1
$27.9 $10.9
$1.7
$13.4 $60.1
Gulf counties
model
Employment
662
3006
1176
181
1448 6473
Output
$70.2
$319.2 $124.8
$19.2
$153.7 $687.1
Value added
$39.0
$177.4 $69.4
$10.7
$85.5 $382.0
Labor income
$25.6
$116.2 $45.4
$7.0
$56.0 $250.2
State and local
taxes
$4.3
$19.4 $7.6
$1,
$9.4
$41.8
Federal taxes
$5.8
$26.4 $10.3
$1.6
$12.7 $56.8
Employment is reported as full-time and part-time jobs and all other measures are reported in millions of 2018 dollars
C. Court et al.