

576
The total economic impacts associated with the estimated change in value for
commercial catch are displayed in Table 33.3 for both the Gulf states model and
Gulf counties model. As expected, results for the Gulf counties model are slightly
lower than that of the Gulf states model, reflecting the fact that counties are smaller,
more open economies. Estimates across the two models suggest that the total economic impacts for the period 2010–2020 of foregone commercial fishing revenues
Table 33.3 Total economic impacts estimated for changes in commercial fishing because of the
oil spill, by state (2010–2020)
Alabama Florida Louisiana Mississippi Texas
Gulf
states
Gulf states
model
Employment
1289
3892
7470
925
5223 18,799
Output
$103.4
$312.2 $599.1
$74.2
$418.9 $1,507.8
Value added
$51.4
$155.3 $298.1
$36.9
$208.4 $750.1
Labor income
$31.1
$93.9 $180.3
$22.3
$126.0 $453.7
State and local
taxes
$8.5
$25.6 $49.2
$6.1
$34.4 $123.7
Federal taxes
$6.8
$20.6 $39.6
$4.9
$27.7 $99.6
Gulf counties
model
Employment
1245
3760
7215
894
5045 18,158
Output
$94.2
$284.5 $546.1
$67.6
$381.8 $1,374.3
Value added
$46.9
$141.7 $272.0
$33.7
$190.2 $684.5
Labor income
$29.1
$87.7 $168.4
$20.9
$117.7 $423.8
State and local
taxes
$7.8
$23.6 $45.3
$5.6
$31.7 $114.0
Federal taxes
$6.3
$19.0 $36.6
$4.5
$25.6 $92.0
Employment is reported as full-time and part-time job-years and all other measures are reported in
millions of 2018 dollars
Ͳ
ϭϬϬ͕ϬϬϬ
ϮϬϬ͕ϬϬϬ
ϯϬϬ͕ϬϬϬ
ϰϬϬ͕ϬϬϬ
ϱϬϬ͕ϬϬϬ
ϲϬϬ͕ϬϬϬ
ϳϬϬ͕ϬϬϬ
ϴϬϬ͕ϬϬϬ
ϵϬϬ͕ϬϬϬ
ϭ͕ϬϬϬ͕ϬϬϬ
ϮϬϭϬ ϮϬϭϭ ϮϬϭϮ ϮϬϭϯ ϮϬϭϰ ϮϬϭϱ ϮϬϭϲ ϮϬϭϳ ϮϬϭϴ ϮϬϭϵ ϮϬϮϬ
DĞƚƌŝĐdŽŶƐ
EŽKŝů
Kŝů
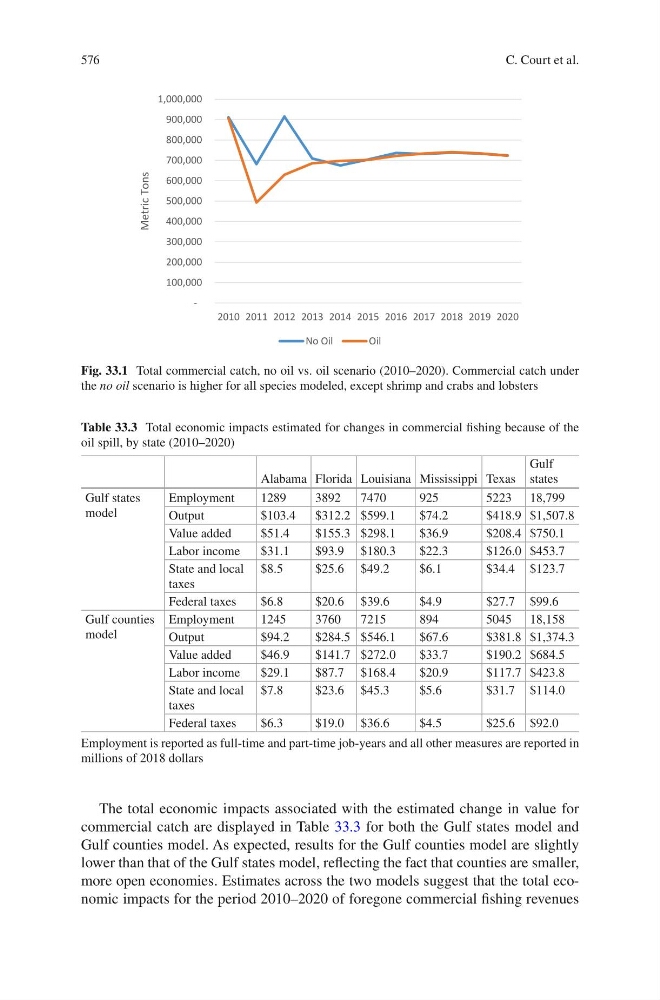
Fig. 33.1 Total commercial catch, no oil vs. oil scenario (2010–2020). Commercial catch under
the no oil scenario is higher for all species modeled, except shrimp and crabs and lobsters
C. Court et al.