

562
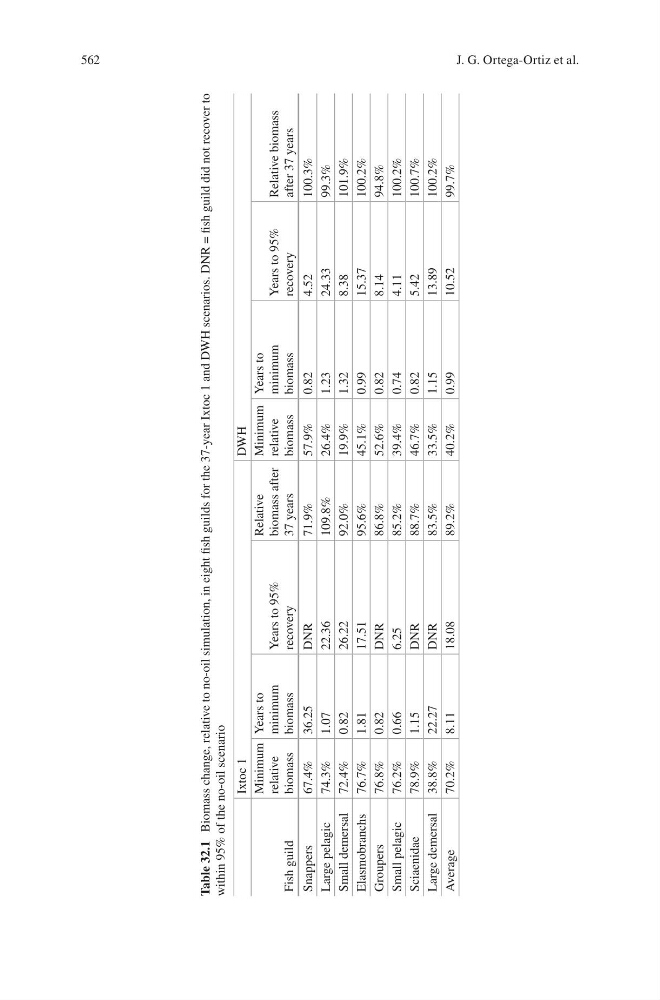
Table 32.1 Biomass change, relative to no-oil simulation, in eight fish guilds for the 37-year Ixtoc 1 and DWH scenarios. DNR = fish guild did not recover to
within 95% of the no-oil scenario
Ixtoc 1
DWH
Fish guild
Minimum
relative
biomass
Years to
minimum
biomass
Years to 95%
recovery
Relative
biomass after
37 years
Minimum
relative
biomass
Years to
minimum
biomass
Years to 95%
recovery
Relative biomass
after 37 years
Snappers
67.4%
36.25
DNR
71.9%
57.9%
0.82
4.52
100.3%
Large pelagic
74.3%
1.07
22.36
109.8%
26.4%
1.23
24.33
99.3%
Small demersal 72.4%
0.82
26.22
92.0%
19.9%
1.32
8.38
101.9%
Elasmobranchs
76.7%
1.81
17.51
95.6%
45.1%
0.99
15.37
100.2%
Groupers
76.8%
0.82
DNR
86.8%
52.6%
0.82
8.14
94.8%
Small pelagic
76.2%
0.66
6.25
85.2%
39.4%
0.74
4.11
100.2%
Sciaenidae
78.9%
1.15
DNR
88.7%
46.7%
0.82
5.42
100.7%
Large demersal
38.8%
22.27
DNR
83.5%
33.5%
1.15
13.89
100.2%
Average
70.2%
8.11
18.08
89.2%
40.2%
0.99
10.52
99.7%
J. G. Ortega-Ortiz et al.