

544
analyses. However, a few functional groups within the benthic invertebrate guild do
exhibit both increases and declines at the polygon level during the window of greatest impact (7–16 months): infaunal meiobenthos, sponges, sessile filter feeders, carnivorous macrobenthos, and blue crab.
Including benthic invertebrate mortality and MOSSFA forcing functions changes
the recovery dynamics of functional groups compared to previous simulations seen
in Ainsworth et al. (2018). However, there is still no distinguishable relationship
between guild biomass minima and recovery time (Fig. 31.3). Of the functional
groups included in the guild analysis within the highly impacted polygons, 27 did
not recover to within 99% of original biomass levels in the worst-case scenario,
roughly 51% of groups examined. In the best-case scenario, ten functional groups
did not recover.
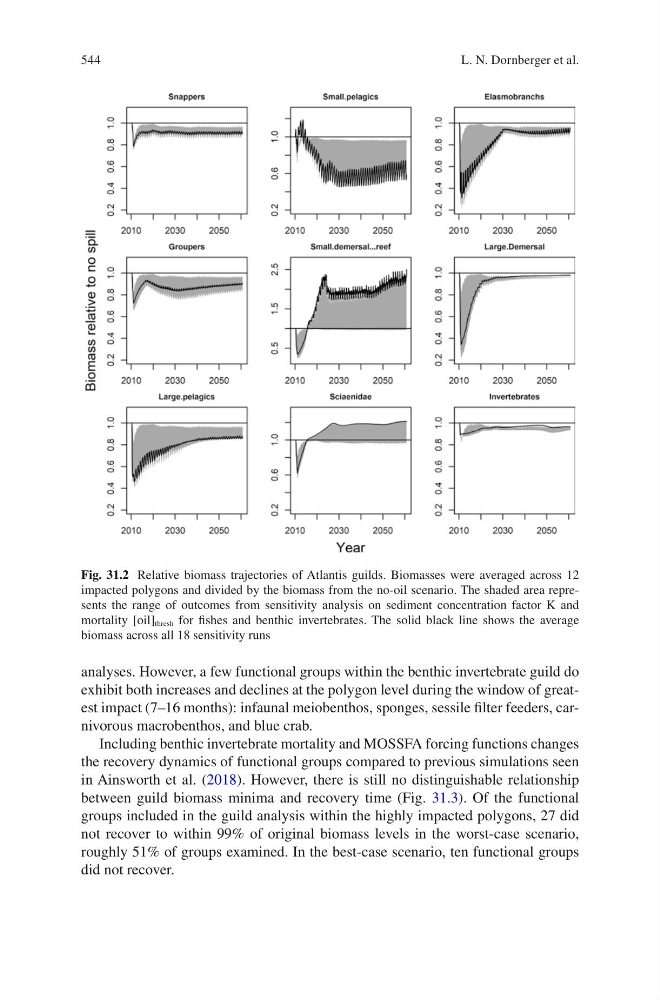
Fig. 31.2 Relative biomass trajectories of Atlantis guilds. Biomasses were averaged across 12
impacted polygons and divided by the biomass from the no-oil scenario. The shaded area represents the range of outcomes from sensitivity analysis on sediment concentration factor K and
mortality [oil] thresh for fishes and benthic invertebrates. The solid black line shows the average
biomass across all 18 sensitivity runs
L. N. Dornberger et al.