

545
31.3.2 Combined Oil and Varied Fishing Mortality Scenarios
Relative biomass differences in the varied F scenarios from the base fishing scenario, for the nine guilds averaged across the 13 heavily impacted polygons, are
shown in Fig. 31.4. The guilds most sensitive to fishing changes combined with
“worst-case” scenario oil were snappers, groupers, and small demersal and reef fish.
Snappers were most affected in the F × 10 scenario. Groupers had the largest positive response to a release of fishing pressure. The guilds least affected by changes in
F were small pelagics and benthic invertebrates.
In general, snappers, groupers, large pelagics, small pelagics, small demersal and
reef, and Sciaenidae all exhibited lower biomass minima when F was increased during the oil spill simulation. Representative example guilds from this list are shown
in Fig. 32.5. All guilds had different biomass trajectories with varied F relative to
the no-oil scenario, and some reached reduced or elevated equilibrium states from
the base F scenario. Snapper biomass oscillated around 0.35 relative to no oil for the
F × 10 scenario and 1.5 for the 0.5 F scenario (Fig. 31.5). Groupers reached a new
equilibrium around 1.2 relative to no oil for the 0.5 F scenario (Fig. 31.5). Both
guilds indicate that while the oil spill had an initial effect on biomass, the long-term
biomass stabilization was dependent upon fishing effort, not magnitude of decline
from the oil spill.
As a guild, benthic invertebrates indicated minor shifts in varied F scenarios.
However, shrimps (brown shrimp, pink shrimp, white shrimp, other shrimps), blue
crab, and lobsters were more heavily impacted by changes in F (Fig. 31.5). In the
F × 10 scenario, blue crab and lobsters exhibit similar trends and go extinct after
8–10 years. Shrimps eventually reach a new reduced equilibrium about 0.75 relative
to no oil, though in all scenarios they initially indicate a severe decline in biomass.
The long-term trends in shrimps indicate that while F plays a role in biomass
stabilization, other food web dynamics that occur as a result of the oil spill allow the
biomass to grow larger than in the control scenario for all scenarios except F × 10.
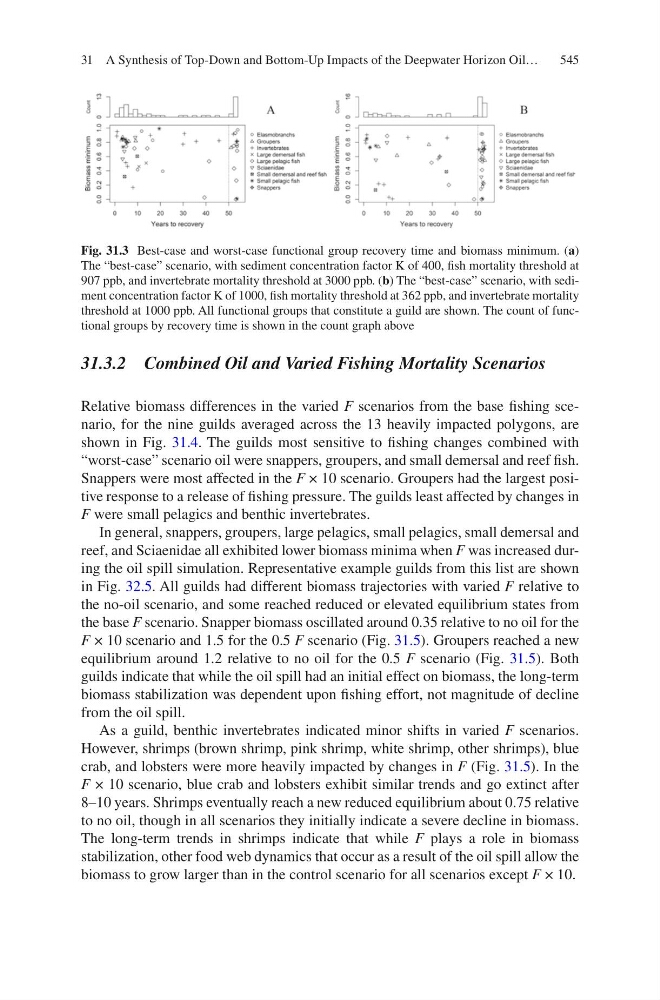
Fig. 31.3 Best-case and worst-case functional group recovery time and biomass minimum. (a)
The “best-case” scenario, with sediment concentration factor K of 400, fish mortality threshold at
907 ppb, and invertebrate mortality threshold at 3000 ppb. (b) The “best-case” scenario, with sediment concentration factor K of 1000, fish mortality threshold at 362 ppb, and invertebrate mortality
threshold at 1000 ppb. All functional groups that constitute a guild are shown. The count of functional groups by recovery time is shown in the count graph above
31 A Synthesis of Top-Down and Bottom-Up Impacts of the Deepwater Horizon Oil…