

541
The growth modifiers G oil and M1 are both applied to Eq. 31.4, the instantaneous
rate of change of biomass (B, in mg N) for each polygon, depth layer, and age class
of functional group i.
dB
dt
T
T
M
P
F
G G
G
i
i
I MM i
E M i
i
j
i j
i
i s
ir
=
+
−
−
− ∑
−
∗
+
Rec
oil
,
,
,
,
,
1
(31.5)
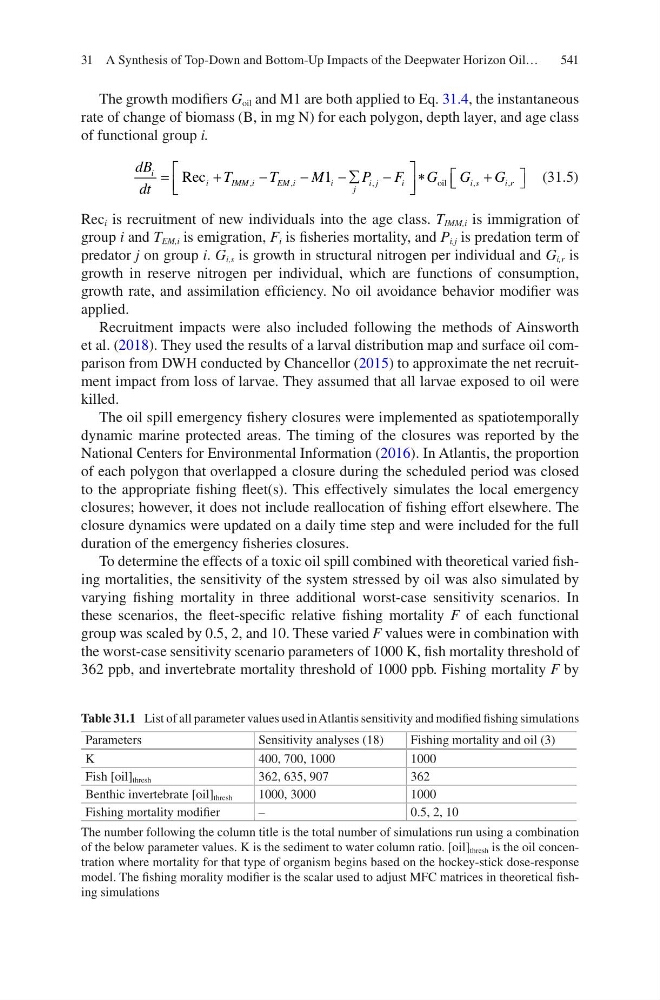
Rec i is recruitment of new individuals into the age class. T IMM,i is immigration of
group i and T EM,i is emigration, F i is fisheries mortality, and P i,j is predation term of
predator j on group i. G i,s is growth in structural nitrogen per individual and G i,r is
growth in reserve nitrogen per individual, which are functions of consumption,
growth rate, and assimilation efficiency. No oil avoidance behavior modifier was
applied.
Recruitment impacts were also included following the methods of Ainsworth
et al. (2018). They used the results of a larval distribution map and surface oil comparison from DWH conducted by Chancellor (2015) to approximate the net recruitment impact from loss of larvae. They assumed that all larvae exposed to oil were
killed.
The oil spill emergency fishery closures were implemented as spatiotemporally
dynamic marine protected areas. The timing of the closures was reported by the
National Centers for Environmental Information (2016). In Atlantis, the proportion
of each polygon that overlapped a closure during the scheduled period was closed
to the appropriate fishing fleet(s). This effectively simulates the local emergency
closures; however, it does not include reallocation of fishing effort elsewhere. The
closure dynamics were updated on a daily time step and were included for the full
duration of the emergency fisheries closures.
To determine the effects of a toxic oil spill combined with theoretical varied fishing mortalities, the sensitivity of the system stressed by oil was also simulated by
varying fishing mortality in three additional worst-case sensitivity scenarios. In
these scenarios, the fleet-specific relative fishing mortality F of each functional
group was scaled by 0.5, 2, and 10. These varied F values were in combination with
the worst-case sensitivity scenario parameters of 1000 K, fish mortality threshold of
362 ppb, and invertebrate mortality threshold of 1000 ppb. Fishing mortality F by
Table 31.1 List of all parameter values used in Atlantis sensitivity and modified fishing simulations
Parameters
Sensitivity analyses (18)
Fishing mortality and oil (3)
K
400, 700, 1000
1000
Fish [oil] thresh
362, 635, 907
362
Benthic invertebrate [oil] thresh
1000, 3000
1000
Fishing mortality modifier
–
0.5, 2, 10
The number following the column title is the total number of simulations run using a combination
of the below parameter values. K is the sediment to water column ratio. [oil] thresh is the oil concentration where mortality for that type of organism begins based on the hockey-stick dose-response
model. The fishing morality modifier is the scalar used to adjust MFC matrices in theoretical fishing simulations
31 A Synthesis of Top-Down and Bottom-Up Impacts of the Deepwater Horizon Oil…