

540
an Akaike information criterion (AIC). For both mortality and growth, the “hockeystick” equations best explained the relationship between oil exposure and fish health
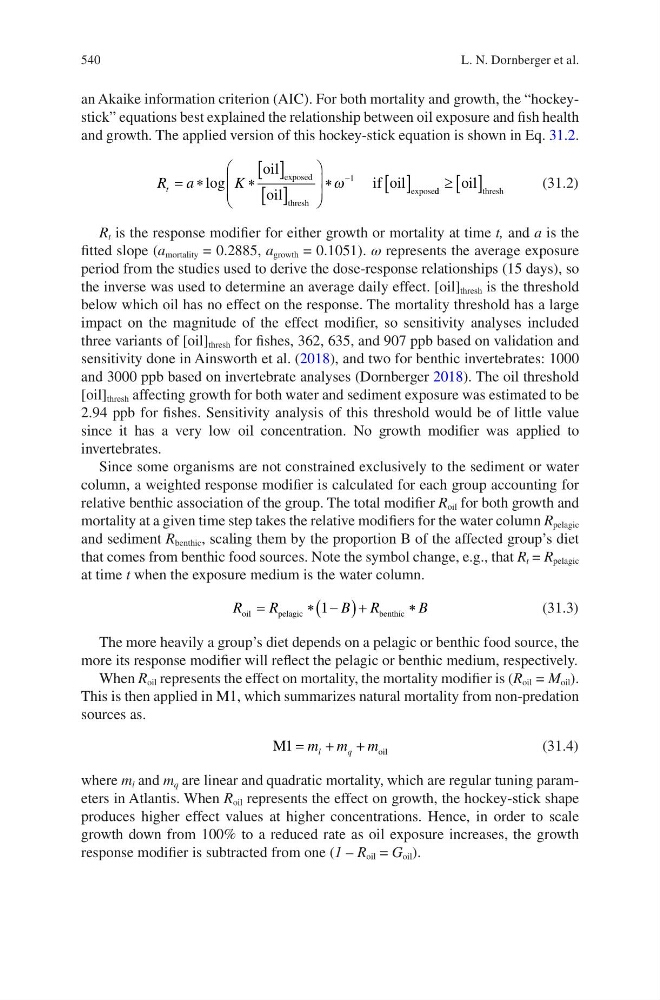
and growth. The applied version of this hockey-stick equation is shown in Eq. 31.2.
R a
K
t = ∗
∗
[ ]
[ ]
∗
[ ]
−
log
oil
oil
if oil
exposed
thresh
expose
ω
1
d d
t hresh
oil
≥ [ ]
(31.2)
R t is the response modifier for either growth or mortality at time t, and a is the
fitted slope (a mortality = 0.2885, a growth = 0.1051). ω represents the average exposure
period from the studies used to derive the dose-response relationships (15 days), so
the inverse was used to determine an average daily effect. [oil] thresh is the threshold
below which oil has no effect on the response. The mortality threshold has a large
impact on the magnitude of the effect modifier, so sensitivity analyses included
three variants of [oil] thresh for fishes, 362, 635, and 907 ppb based on validation and
sensitivity done in Ainsworth et al. (2018), and two for benthic invertebrates: 1000
and 3000 ppb based on invertebrate analyses (Dornberger 2018). The oil threshold
[oil] thresh affecting growth for both water and sediment exposure was estimated to be
2.94 ppb for fishes. Sensitivity analysis of this threshold would be of little value
since it has a very low oil concentration. No growth modifier was applied to
invertebrates.
Since some organisms are not constrained exclusively to the sediment or water
column, a weighted response modifier is calculated for each group accounting for
relative benthic association of the group. The total modifier R oil for both growth and
mortality at a given time step takes the relative modifiers for the water column R pelagic
and sediment R benthic , scaling them by the proportion B of the affected group’s diet
that comes from benthic food sources. Note the symbol change, e.g., that R t = R pelagic
at time t when the exposure medium is the water column.
R
R
B R
B
oil
p elagic
benthic
=
∗ −
(
)+
∗
1
(31.3)
The more heavily a group’s diet depends on a pelagic or benthic food source, the
more its response modifier will reflect the pelagic or benthic medium, respectively.
When R oil represents the effect on mortality, the mortality modifier is (R oil = M oil ).
This is then applied in M1, which summarizes natural mortality from non-predation
sources as.
M
oil
1 = +
+
m m m
l
q
(31.4)
where m l and m q are linear and quadratic mortality, which are regular tuning parameters in Atlantis. When R oil represents the effect on growth, the hockey- stick shape
produces higher effect values at higher concentrations. Hence, in order to scale
growth down from 100% to a reduced rate as oil exposure increases, the growth
response modifier is subtracted from one (1 – R oil = G oil ).
L. N. Dornberger et al.