

539
The sediment-to-water column ratio (K) is potentially up to 1000:1 (Ainsworth
et al. 2018), so a K = 1000 (unitless) was used as an upper limit of sensitivity analyses, along with K = 700 and K = 400. K plays a critical role in the impact of the oil
spill on benthic organisms.
Metabolic processing of oil for all fish and benthic invertebrates was accounted
for by calculating uptake and depuration rates based on data from a fish exposure
study. Miller et al. (2017) exposed sub-adult red drum to a DWH surrogate oil and
Corexit 9500 CEWAF solution actual average 0.66 ± 0.092 ppm TPH for 4 days of
uptake, followed by 6 days of contaminant free seawater depuration. During this
experiment, two fish were sacrificed every day during the uptake period and then
every other day during depuration to assess liver PAH concentrations. The ∑50PAH
concentrations measured each day in the liver over the 4 days of uptake were used
to calculate a linear regression uptake value based on the average 0.66 ± 0.092 ppm
TPH exposure, resulting in an average uptake of 2.13 ppm ∑50PAH/day over the
4-day period. The use of nominal concentrations results in a conservative uptake
calculation. The exposure to uptake ratio is 0.47. This can be used to estimate the
uptake rate at any exposure level assuming a linear relationship. To reflect uptake in
Atlantis, current oil exposure values were divided by 0.47 to generate the exposurespecific linear uptake rate μ. To calculate depuration rate, the peak average liver
concentration and subsequent concentrations at 2, 4, and 6 days post exposure were
used to calculate an exponential decay formula. When external exposure ends, the
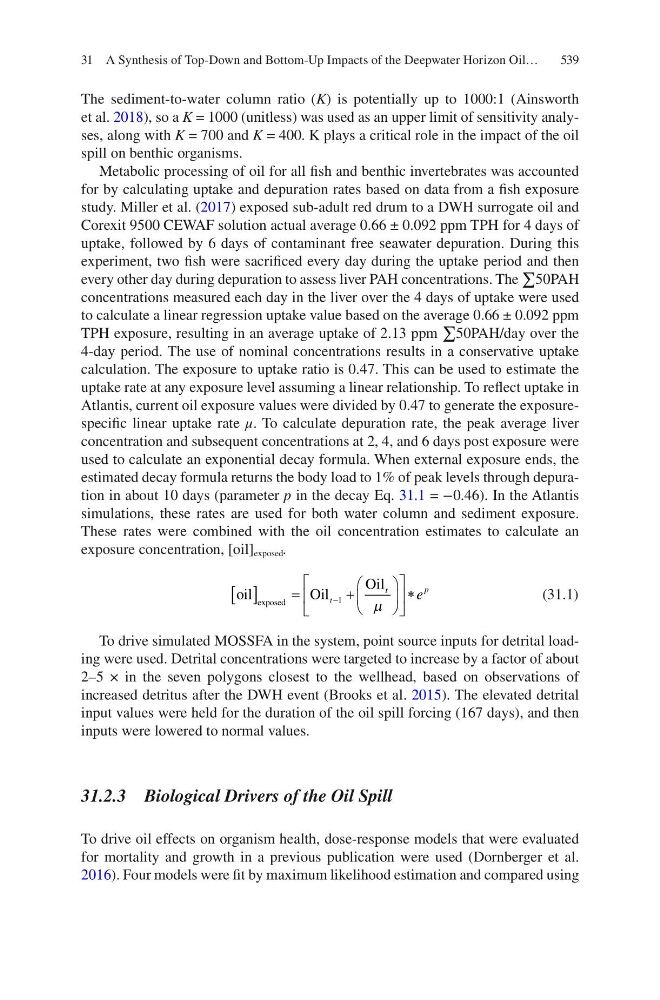
estimated decay formula returns the body load to 1% of peak levels through depuration in about 10 days (parameter p in the decay Eq. 31.1 = −0.46). In the Atlantis
simulations, these rates are used for both water column and sediment exposure.
These rates were combined with the oil concentration estimates to calculate an
exposure concentration, [oil] exposed .
oil
O il
Oil
exposed
[ ]
=
+
∗
−
t
t
p
e
1
µ
(31.1)
To drive simulated MOSSFA in the system, point source inputs for detrital loading were used. Detrital concentrations were targeted to increase by a factor of about
2–5 × in the seven polygons closest to the wellhead, based on observations of
increased detritus after the DWH event (Brooks et al. 2015). The elevated detrital
input values were held for the duration of the oil spill forcing (167 days), and then
inputs were lowered to normal values.
31.2.3 Biological Drivers of the Oil Spill
To drive oil effects on organism health, dose-response models that were evaluated
for mortality and growth in a previous publication were used (Dornberger et al.
2016). Four models were fit by maximum likelihood estimation and compared using
31 A Synthesis of Top-Down and Bottom-Up Impacts of the Deepwater Horizon Oil…