

446
Table 26.2 Estimated average annual percent change in marine mammal presence including [5th,
95th] confidence intervals at passive acoustic monitoring sites in the GOM HARP study,
2010–2016
Site Sperm whale Kogia spp.
Cuvier’s BW
Gervais’
BW
Risso’s
dolphin
Stenella
delphinid
Blackfish
delphinid
MC −4.5
[−6.0, −3.3]
18.8
[12.9, 26.3]
5.4
a
[2.0, 8.7]
37.3
a
[24.3, 52.8]
8.7
[2.1, 19.4]
−1.6
[−3.5, 0.2]
−7.0
[−9.0, −4.6]
GC −8.3
[−10.0, −6.4]
−15.5
[−16.3, −14.8]
1.0
[−3.0, 6.3]
4.1
[1.4, 7.3]
−5.0
[−9.1, 0.0]
−10.9
[−12.2, −9.7]
−11.1
[−13.5, −9.3]
DT 5.4
[−0.3, 13.6]
−9.0
[−11.8, −5.4]
−9.7
[−11.0, −8.9]
−8.1
[−9.1, −6.6]
4.2
[1.4, 8.1]
−13.0
[−14.2, −11.5]
1.3
[−4.1, 10.2]
a
Indicates subset from 2010 to 2013 was used to calculate slope
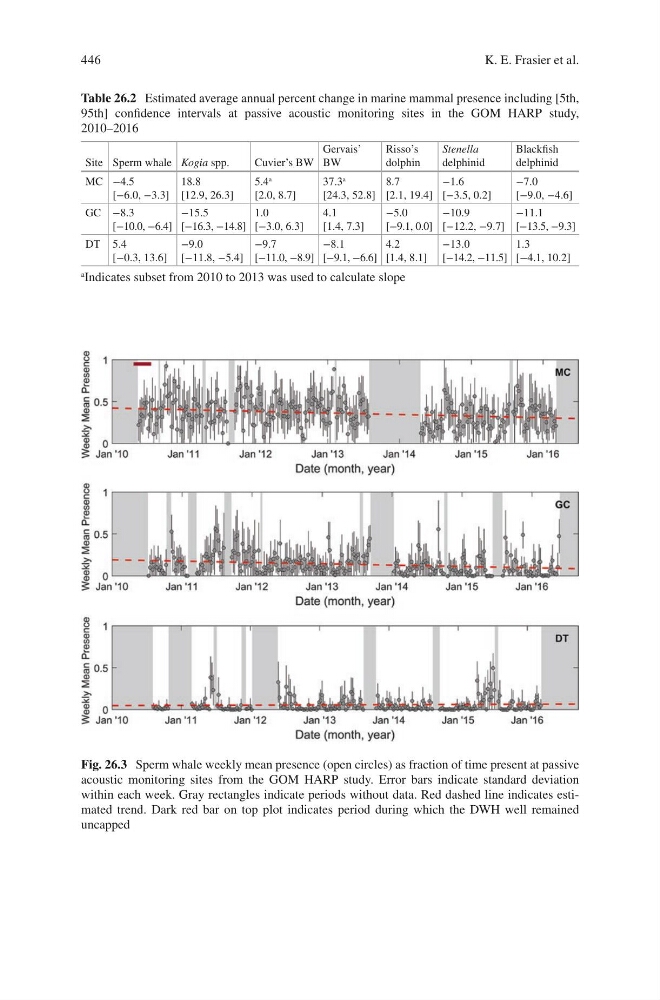
Fig. 26.3 Sperm whale weekly mean presence (open circles) as fraction of time present at passive
acoustic monitoring sites from the GOM HARP study. Error bars indicate standard deviation
within each week. Gray rectangles indicate periods without data. Red dashed line indicates estimated trend. Dark red bar on top plot indicates period during which the DWH well remained
uncapped
K. E. Frasier et al.
Table 26.2 Estimated average annual percent change in marine mammal presence including [5th,
95th] confidence intervals at passive acoustic monitoring sites in the GOM HARP study,
2010–2016
Site Sperm whale Kogia spp.
Cuvier’s BW
Gervais’
BW
Risso’s
dolphin
Stenella
delphinid
Blackfish
delphinid
MC −4.5
[−6.0, −3.3]
18.8
[12.9, 26.3]
5.4
a
[2.0, 8.7]
37.3
a
[24.3, 52.8]
8.7
[2.1, 19.4]
−1.6
[−3.5, 0.2]
−7.0
[−9.0, −4.6]
GC −8.3
[−10.0, −6.4]
−15.5
[−16.3, −14.8]
1.0
[−3.0, 6.3]
4.1
[1.4, 7.3]
−5.0
[−9.1, 0.0]
−10.9
[−12.2, −9.7]
−11.1
[−13.5, −9.3]
DT 5.4
[−0.3, 13.6]
−9.0
[−11.8, −5.4]
−9.7
[−11.0, −8.9]
−8.1
[−9.1, −6.6]
4.2
[1.4, 8.1]
−13.0
[−14.2, −11.5]
1.3
[−4.1, 10.2]
a
Indicates subset from 2010 to 2013 was used to calculate slope
Fig. 26.3 Sperm whale weekly mean presence (open circles) as fraction of time present at passive
acoustic monitoring sites from the GOM HARP study. Error bars indicate standard deviation
within each week. Gray rectangles indicate periods without data. Red dashed line indicates estimated trend. Dark red bar on top plot indicates period during which the DWH well remained
uncapped
K. E. Frasier et al.