

445
26.5 Long-Term Effects
We consider long-term effects of the DWH oil spill on marine megafauna as those
occurring after the initial response and cleanup period, extending months to years
after the event.
26.5.1 Findings of Marine Mammal Passive Acoustic Studies
The GOM HARP project (Frasier et al. 2017; Hildebrand et al. 2015) provides the
only long-term time series documenting marine mammal occurrence in oiled and
unoiled oceanic habitats during and after the DWH oil spill. Data collected between
2010 and 2016 are discussed here. Mean weekly presence was calculated for each
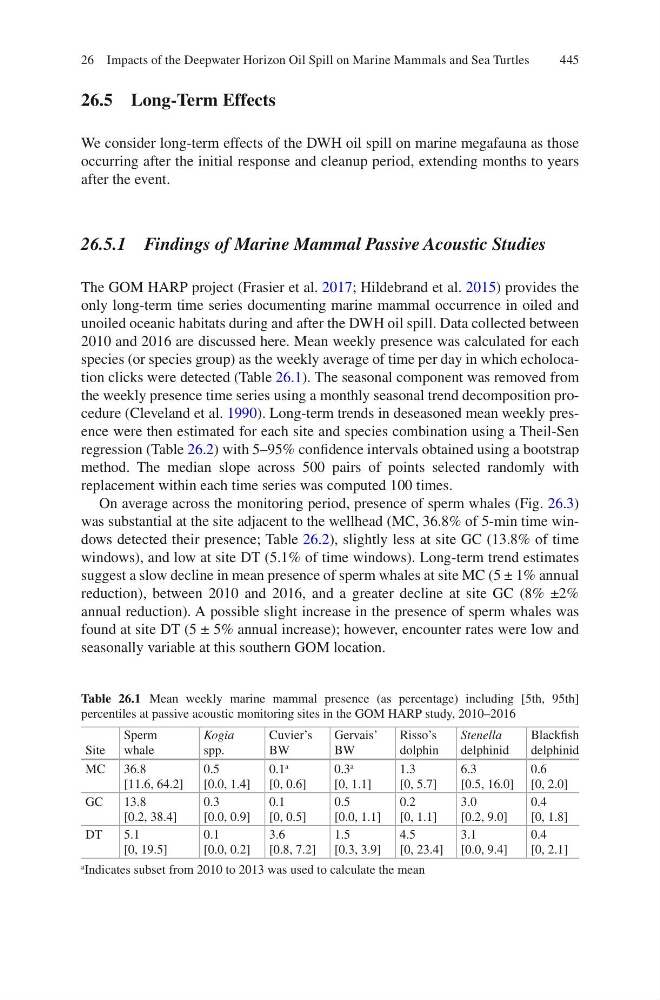
species (or species group) as the weekly average of time per day in which echolocation clicks were detected (Table 26.1). The seasonal component was removed from
the weekly presence time series using a monthly seasonal trend decomposition procedure (Cleveland et al. 1990). Long-term trends in deseasoned mean weekly presence were then estimated for each site and species combination using a Theil-Sen
regression (Table 26.2) with 5–95% confidence intervals obtained using a bootstrap
method. The median slope across 500 pairs of points selected randomly with
replacement within each time series was computed 100 times.
On average across the monitoring period, presence of sperm whales (Fig. 26.3)
was substantial at the site adjacent to the wellhead (MC, 36.8% of 5-min time windows detected their presence; Table 26.2), slightly less at site GC (13.8% of time
windows), and low at site DT (5.1% of time windows). Long-term trend estimates
suggest a slow decline in mean presence of sperm whales at site MC (5 ± 1% annual
reduction), between 2010 and 2016, and a greater decline at site GC (8% ±2%
annual reduction). A possible slight increase in the presence of sperm whales was
found at site DT (5 ± 5% annual increase); however, encounter rates were low and
seasonally variable at this southern GOM location.
Table 26.1 Mean weekly marine mammal presence (as percentage) including [5th, 95th]
percentiles at passive acoustic monitoring sites in the GOM HARP study, 2010–2016
Site
Sperm
whale
Kogia
spp.
Cuvier’s
BW
Gervais’
BW
Risso’s
dolphin
Stenella
delphinid
Blackfish
delphinid
MC 36.8
[11.6, 64.2]
0.5
[0.0, 1.4]
0.1
a
[0, 0.6]
0.3
a
[0, 1.1]
1.3
[0, 5.7]
6.3
[0.5, 16.0]
0.6
[0, 2.0]
GC
13.8
[0.2, 38.4]
0.3
[0.0, 0.9]
0.1
[0, 0.5]
0.5
[0.0, 1.1]
0.2
[0, 1.1]
3.0
[0.2, 9.0]
0.4
[0, 1.8]
DT
5.1
[0, 19.5]
0.1
[0.0, 0.2]
3.6
[0.8, 7.2]
1.5
[0.3, 3.9]
4.5
[0, 23.4]
3.1
[0.0, 9.4]
0.4
[0, 2.1]
a
Indicates subset from 2010 to 2013 was used to calculate the mean
26 Impacts of the Deepwater Horizon Oil Spill on Marine Mammals and Sea Turtles
26.5 Long-Term Effects
We consider long-term effects of the DWH oil spill on marine megafauna as those
occurring after the initial response and cleanup period, extending months to years
after the event.
26.5.1 Findings of Marine Mammal Passive Acoustic Studies
The GOM HARP project (Frasier et al. 2017; Hildebrand et al. 2015) provides the
only long-term time series documenting marine mammal occurrence in oiled and
unoiled oceanic habitats during and after the DWH oil spill. Data collected between
2010 and 2016 are discussed here. Mean weekly presence was calculated for each
species (or species group) as the weekly average of time per day in which echolocation clicks were detected (Table 26.1). The seasonal component was removed from
the weekly presence time series using a monthly seasonal trend decomposition procedure (Cleveland et al. 1990). Long-term trends in deseasoned mean weekly presence were then estimated for each site and species combination using a Theil-Sen
regression (Table 26.2) with 5–95% confidence intervals obtained using a bootstrap
method. The median slope across 500 pairs of points selected randomly with
replacement within each time series was computed 100 times.
On average across the monitoring period, presence of sperm whales (Fig. 26.3)
was substantial at the site adjacent to the wellhead (MC, 36.8% of 5-min time windows detected their presence; Table 26.2), slightly less at site GC (13.8% of time
windows), and low at site DT (5.1% of time windows). Long-term trend estimates
suggest a slow decline in mean presence of sperm whales at site MC (5 ± 1% annual
reduction), between 2010 and 2016, and a greater decline at site GC (8% ±2%
annual reduction). A possible slight increase in the presence of sperm whales was
found at site DT (5 ± 5% annual increase); however, encounter rates were low and
seasonally variable at this southern GOM location.
Table 26.1 Mean weekly marine mammal presence (as percentage) including [5th, 95th]
percentiles at passive acoustic monitoring sites in the GOM HARP study, 2010–2016
Site
Sperm
whale
Kogia
spp.
Cuvier’s
BW
Gervais’
BW
Risso’s
dolphin
Stenella
delphinid
Blackfish
delphinid
MC 36.8
[11.6, 64.2]
0.5
[0.0, 1.4]
0.1
a
[0, 0.6]
0.3
a
[0, 1.1]
1.3
[0, 5.7]
6.3
[0.5, 16.0]
0.6
[0, 2.0]
GC
13.8
[0.2, 38.4]
0.3
[0.0, 0.9]
0.1
[0, 0.5]
0.5
[0.0, 1.1]
0.2
[0, 1.1]
3.0
[0.2, 9.0]
0.4
[0, 1.8]
DT
5.1
[0, 19.5]
0.1
[0.0, 0.2]
3.6
[0.8, 7.2]
1.5
[0.3, 3.9]
4.5
[0, 23.4]
3.1
[0.0, 9.4]
0.4
[0, 2.1]
a
Indicates subset from 2010 to 2013 was used to calculate the mean
26 Impacts of the Deepwater Horizon Oil Spill on Marine Mammals and Sea Turtles