

148
models to consider a more realistic range of droplet characteristics. It also supports
the inclusion of individual droplet composition, as achieved by oil-CMS in the form
of fractions for pseudo-components, so that simulated oil biogeochemical processes
(i.e., biodegradation, evaporation, and dissolution) are parameterized within appropriate rates for different chemical components.
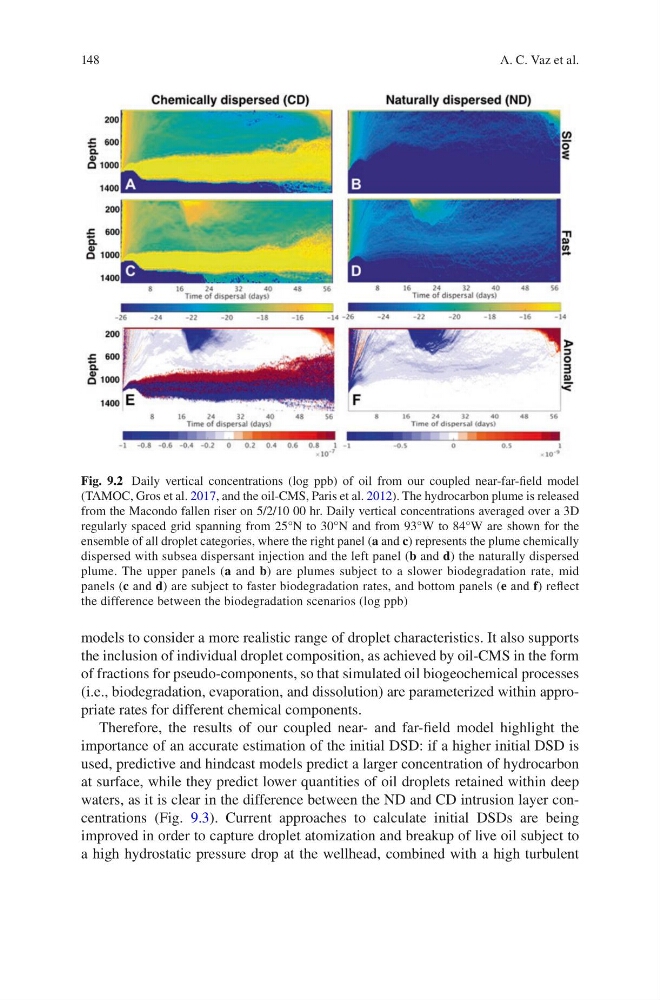
Therefore, the results of our coupled near- and far-field model highlight the
importance of an accurate estimation of the initial DSD: if a higher initial DSD is
used, predictive and hindcast models predict a larger concentration of hydrocarbon
at surface, while they predict lower quantities of oil droplets retained within deep
waters, as it is clear in the difference between the ND and CD intrusion layer concentrations (Fig. 9.3). Current approaches to calculate initial DSDs are being
improved in order to capture droplet atomization and breakup of live oil subject to
a high hydrostatic pressure drop at the wellhead, combined with a high turbulent
Fig. 9.2 Daily vertical concentrations (log ppb) of oil from our coupled near-far-field model
(TAMOC, Gros et al. 2017, and the oil-CMS, Paris et al. 2012). The hydrocarbon plume is released
from the Macondo fallen riser on 5/2/10 00 hr. Daily vertical concentrations averaged over a 3D
regularly spaced grid spanning from 25°N to 30°N and from 93°W to 84°W are shown for the
ensemble of all droplet categories, where the right panel (a and c) represents the plume chemically
dispersed with subsea dispersant injection and the left panel (b and d) the naturally dispersed
plume. The upper panels (a and b) are plumes subject to a slower biodegradation rate, mid
panels (c and d) are subject to faster biodegradation rates, and bottom panels (e and f) reflect
the difference between the biodegradation scenarios (log ppb)
A. C. Vaz et al.
models to consider a more realistic range of droplet characteristics. It also supports
the inclusion of individual droplet composition, as achieved by oil-CMS in the form
of fractions for pseudo-components, so that simulated oil biogeochemical processes
(i.e., biodegradation, evaporation, and dissolution) are parameterized within appropriate rates for different chemical components.
Therefore, the results of our coupled near- and far-field model highlight the
importance of an accurate estimation of the initial DSD: if a higher initial DSD is
used, predictive and hindcast models predict a larger concentration of hydrocarbon
at surface, while they predict lower quantities of oil droplets retained within deep
waters, as it is clear in the difference between the ND and CD intrusion layer concentrations (Fig. 9.3). Current approaches to calculate initial DSDs are being
improved in order to capture droplet atomization and breakup of live oil subject to
a high hydrostatic pressure drop at the wellhead, combined with a high turbulent
Fig. 9.2 Daily vertical concentrations (log ppb) of oil from our coupled near-far-field model
(TAMOC, Gros et al. 2017, and the oil-CMS, Paris et al. 2012). The hydrocarbon plume is released
from the Macondo fallen riser on 5/2/10 00 hr. Daily vertical concentrations averaged over a 3D
regularly spaced grid spanning from 25°N to 30°N and from 93°W to 84°W are shown for the
ensemble of all droplet categories, where the right panel (a and c) represents the plume chemically
dispersed with subsea dispersant injection and the left panel (b and d) the naturally dispersed
plume. The upper panels (a and b) are plumes subject to a slower biodegradation rate, mid
panels (c and d) are subject to faster biodegradation rates, and bottom panels (e and f) reflect
the difference between the biodegradation scenarios (log ppb)
A. C. Vaz et al.