

147
When considering different biodegradation rates, a faster biodegradation rate
reduces oil droplet concentrations in the water column at the end of the 60-day
simulations compared to simulations with slower rates. For the simulations in
Fig. 9.3, oil concentrations (in ppb) are reduced by ~4% for both the ND and the CD
cases in the faster-rate simulations compared to the slow-rate ones. However, since
the ND plume is constrained to the surface, changes in biodegradation rates affect
primarily surface oil, while for the CD cases, biodegradation can change oil distributions throughout the water column (Figs. 9.2e, f and 9.3). In our simulations, the
small oil droplets in the deep intrusion remains mostly bellow 1000 m for the faster
biodegradation scenario, while they spread from 500 m to 1000 m for the slower
biodegradation case. The differences observed highlight the need for predictive
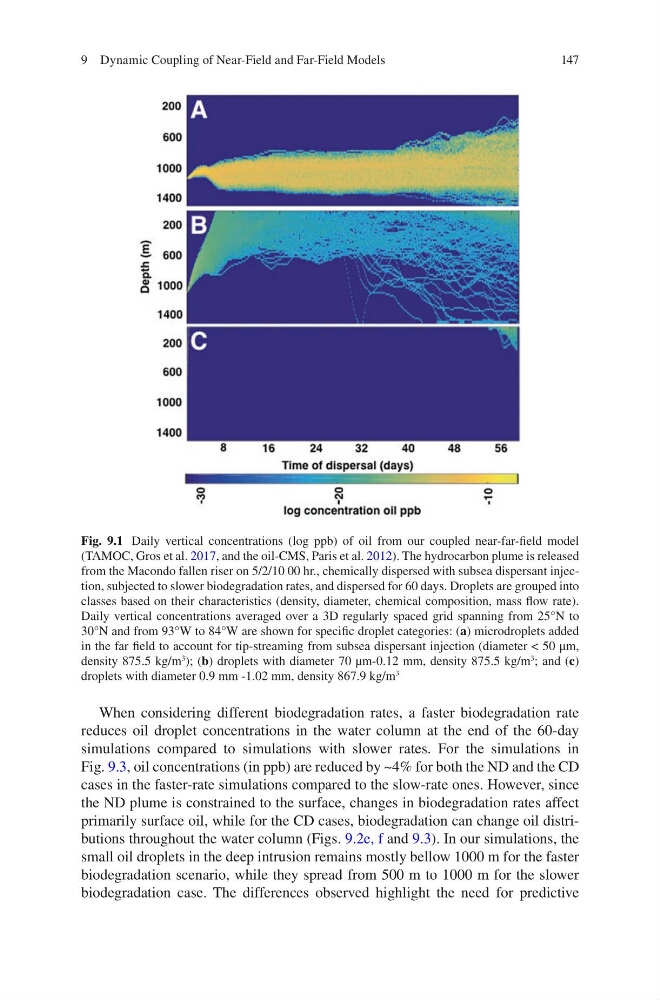
Fig. 9.1 Daily vertical concentrations (log ppb) of oil from our coupled near-far-field model
(TAMOC, Gros et al. 2017, and the oil-CMS, Paris et al. 2012). The hydrocarbon plume is released
from the Macondo fallen riser on 5/2/10 00 hr., chemically dispersed with subsea dispersant injection, subjected to slower biodegradation rates, and dispersed for 60 days. Droplets are grouped into
classes based on their characteristics (density, diameter, chemical composition, mass flow rate).
Daily vertical concentrations averaged over a 3D regularly spaced grid spanning from 25°N to
30°N and from 93°W to 84°W are shown for specific droplet categories: (a) microdroplets added
in the far field to account for tip-streaming from subsea dispersant injection (diameter < 50 μm,
density 875.5 kg/m
3 ); (b) droplets with diameter 70 µm-0.12 mm, density 875.5 kg/m
3
; and (c)
droplets with diameter 0.9 mm -1.02 mm, density 867.9 kg/m
3
9 Dynamic Coupling of Near-Field and Far-Field Models
When considering different biodegradation rates, a faster biodegradation rate
reduces oil droplet concentrations in the water column at the end of the 60-day
simulations compared to simulations with slower rates. For the simulations in
Fig. 9.3, oil concentrations (in ppb) are reduced by ~4% for both the ND and the CD
cases in the faster-rate simulations compared to the slow-rate ones. However, since
the ND plume is constrained to the surface, changes in biodegradation rates affect
primarily surface oil, while for the CD cases, biodegradation can change oil distributions throughout the water column (Figs. 9.2e, f and 9.3). In our simulations, the
small oil droplets in the deep intrusion remains mostly bellow 1000 m for the faster
biodegradation scenario, while they spread from 500 m to 1000 m for the slower
biodegradation case. The differences observed highlight the need for predictive
Fig. 9.1 Daily vertical concentrations (log ppb) of oil from our coupled near-far-field model
(TAMOC, Gros et al. 2017, and the oil-CMS, Paris et al. 2012). The hydrocarbon plume is released
from the Macondo fallen riser on 5/2/10 00 hr., chemically dispersed with subsea dispersant injection, subjected to slower biodegradation rates, and dispersed for 60 days. Droplets are grouped into
classes based on their characteristics (density, diameter, chemical composition, mass flow rate).
Daily vertical concentrations averaged over a 3D regularly spaced grid spanning from 25°N to
30°N and from 93°W to 84°W are shown for specific droplet categories: (a) microdroplets added
in the far field to account for tip-streaming from subsea dispersant injection (diameter < 50 μm,
density 875.5 kg/m
3 ); (b) droplets with diameter 70 µm-0.12 mm, density 875.5 kg/m
3
; and (c)
droplets with diameter 0.9 mm -1.02 mm, density 867.9 kg/m
3
9 Dynamic Coupling of Near-Field and Far-Field Models