

2.4 Evaluation of Energy Consumption of Anaerobic Fermentation Process
59
Table 2.6 Energy flow analysis of different anaerobic fermentation processes
SHP-S
NSHP-S
SHP-T
NSHP-T
Hydrogen production ratio (VS L/g)
–
–
0.14
0.11
Methane production ratio (VS L/g)
1.73
1.66
3.52
2.64
Hydrogen production (L/d)
–
–
1400
1100
Methane production (L/d)
17,300
16,600
35,200
26,400
Hydrogen (g)
–
–
125.86
98.89
Methane (g)
12,404.1
11,902.2
25,238.4
18,928.8
Hydrogen heat gain (KJ/d)
–
–
17,997.98
14,141.27
Methane heat gain (KJ/d)
693,389.2
665,333
1,410,827
1,058,120
Total heat (KJ/d)
693,389.2
665,333
1,428,825
1,072,261
E LY = Q LY − E L − Q Y
(2.11)
where, E JS , E JY , E LS and E LY represent the net energy income through JS, JY, LS
and LY treatments, respectively.
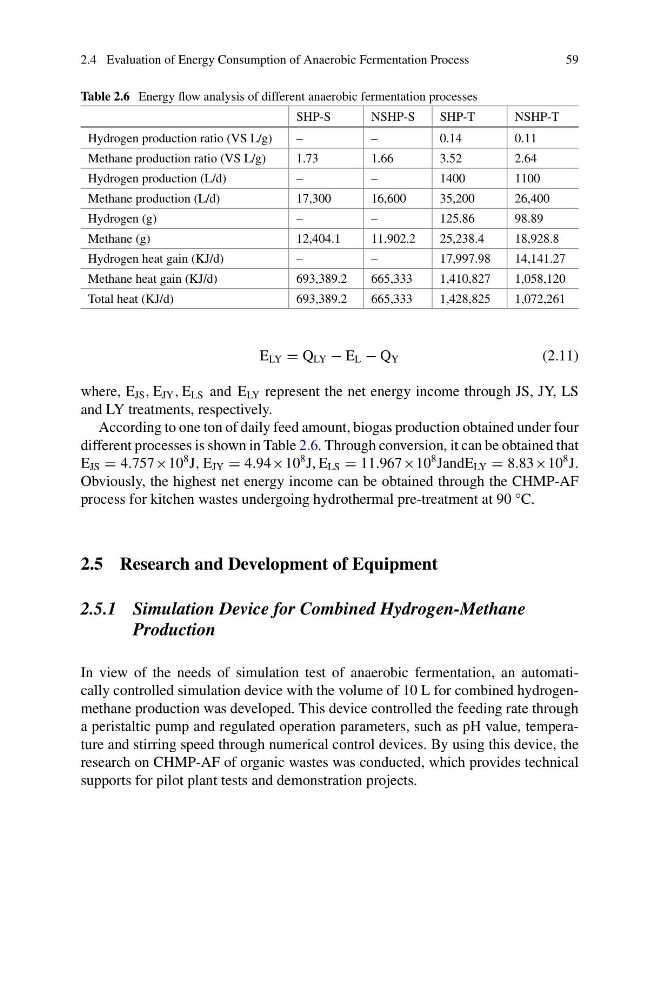
According to one ton of daily feed amount, biogas production obtained under four
different processes is shown in Table 2.6. Through conversion, it can be obtained that
E JS = 4.757×10
8 J, E JY = 4.94×10
8 J, E LS = 11.967×10
8 JandE LY = 8.83×10
8 J.
Obviously, the highest net energy income can be obtained through the CHMP-AF
process for kitchen wastes undergoing hydrothermal pre-treatment at 90 °C.
2.5 Research and Development of Equipment
2.5.1 Simulation Device for Combined Hydrogen-Methane
Production
In view of the needs of simulation test of anaerobic fermentation, an automatically controlled simulation device with the volume of 10 L for combined hydrogenmethane production was developed. This device controlled the feeding rate through
a peristaltic pump and regulated operation parameters, such as pH value, temperature and stirring speed through numerical control devices. By using this device, the
research on CHMP-AF of organic wastes was conducted, which provides technical
supports for pilot plant tests and demonstration projects.
59
Table 2.6 Energy flow analysis of different anaerobic fermentation processes
SHP-S
NSHP-S
SHP-T
NSHP-T
Hydrogen production ratio (VS L/g)
–
–
0.14
0.11
Methane production ratio (VS L/g)
1.73
1.66
3.52
2.64
Hydrogen production (L/d)
–
–
1400
1100
Methane production (L/d)
17,300
16,600
35,200
26,400
Hydrogen (g)
–
–
125.86
98.89
Methane (g)
12,404.1
11,902.2
25,238.4
18,928.8
Hydrogen heat gain (KJ/d)
–
–
17,997.98
14,141.27
Methane heat gain (KJ/d)
693,389.2
665,333
1,410,827
1,058,120
Total heat (KJ/d)
693,389.2
665,333
1,428,825
1,072,261
E LY = Q LY − E L − Q Y
(2.11)
where, E JS , E JY , E LS and E LY represent the net energy income through JS, JY, LS
and LY treatments, respectively.
According to one ton of daily feed amount, biogas production obtained under four
different processes is shown in Table 2.6. Through conversion, it can be obtained that
E JS = 4.757×10
8 J, E JY = 4.94×10
8 J, E LS = 11.967×10
8 JandE LY = 8.83×10
8 J.
Obviously, the highest net energy income can be obtained through the CHMP-AF
process for kitchen wastes undergoing hydrothermal pre-treatment at 90 °C.
2.5 Research and Development of Equipment
2.5.1 Simulation Device for Combined Hydrogen-Methane
Production
In view of the needs of simulation test of anaerobic fermentation, an automatically controlled simulation device with the volume of 10 L for combined hydrogenmethane production was developed. This device controlled the feeding rate through
a peristaltic pump and regulated operation parameters, such as pH value, temperature and stirring speed through numerical control devices. By using this device, the
research on CHMP-AF of organic wastes was conducted, which provides technical
supports for pilot plant tests and demonstration projects.