

Chapter II
Extreme Events
17
í µí¼ > 0 and í µí¼ = 0 are of most interest, since this sort of data rarely have tails lighter than normal
(Coles, 2001).
The Generalized Extreme Value (GEV) distribution is commonly used in the field of coastal
engineering to estimate the probability of extreme events, such as storm surges, waves, and sea
level rise. Two popular methods for estimating return periods using the GEV distribution are the
Gumbel and Weibull methods.
In this study, the data analysis process was conducted using the Python programming language,
with the help of the Pyextreme library. It offers an efficient and effective way to analyze data.
The output of the analysis was presented in the form of graphs and tables, which provided a
visual representation of the findings.
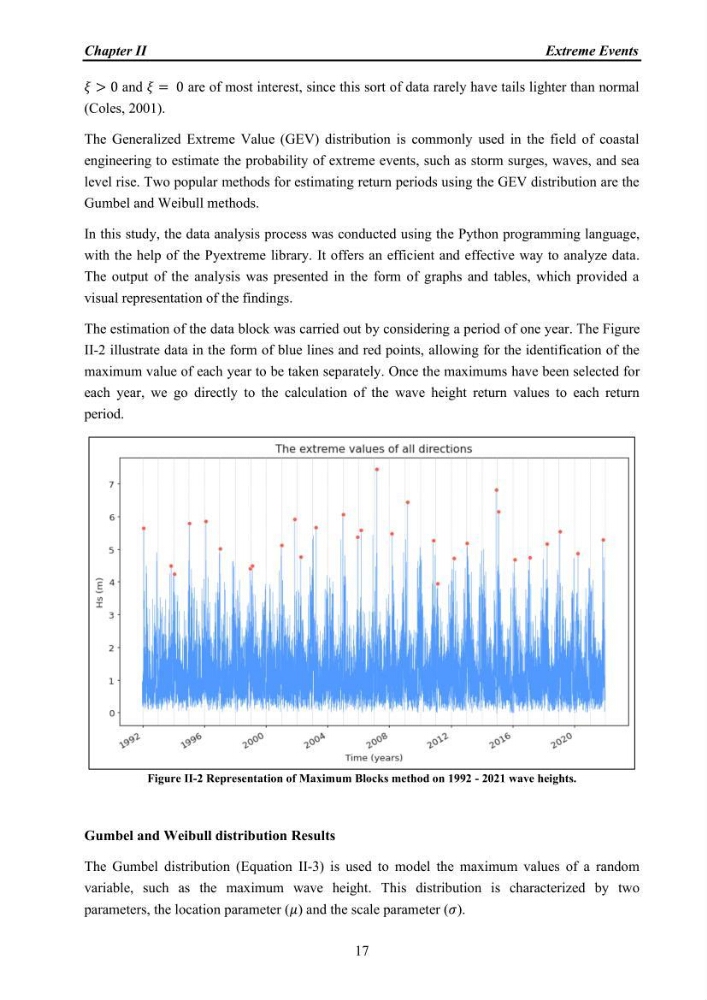
The estimation of the data block was carried out by considering a period of one year. The Figure
II-2 illustrate data in the form of blue lines and red points, allowing for the identification of the
maximum value of each year to be taken separately. Once the maximums have been selected for
each year, we go directly to the calculation of the wave height return values to each return
period.
Figure II-2 Representation of Maximum Blocks method on 1992 - 2021 wave heights.
Gumbel and Weibull distribution Results
The Gumbel distribution (Equation II-3) is used to model the maximum values of a random
variable, such as the maximum wave height. This distribution is characterized by two
parameters, the location parameter (í µí¼) and the scale parameter (í µí¼).
Extreme Events
17
í µí¼ > 0 and í µí¼ = 0 are of most interest, since this sort of data rarely have tails lighter than normal
(Coles, 2001).
The Generalized Extreme Value (GEV) distribution is commonly used in the field of coastal
engineering to estimate the probability of extreme events, such as storm surges, waves, and sea
level rise. Two popular methods for estimating return periods using the GEV distribution are the
Gumbel and Weibull methods.
In this study, the data analysis process was conducted using the Python programming language,
with the help of the Pyextreme library. It offers an efficient and effective way to analyze data.
The output of the analysis was presented in the form of graphs and tables, which provided a
visual representation of the findings.
The estimation of the data block was carried out by considering a period of one year. The Figure
II-2 illustrate data in the form of blue lines and red points, allowing for the identification of the
maximum value of each year to be taken separately. Once the maximums have been selected for
each year, we go directly to the calculation of the wave height return values to each return
period.
Figure II-2 Representation of Maximum Blocks method on 1992 - 2021 wave heights.
Gumbel and Weibull distribution Results
The Gumbel distribution (Equation II-3) is used to model the maximum values of a random
variable, such as the maximum wave height. This distribution is characterized by two
parameters, the location parameter (í µí¼) and the scale parameter (í µí¼).