

Chapter II
Extreme Events
18
í µí°¹(í µí±¥; í µí¼, σ) = í µí±
−í µí± −(í µí±¥−í µí¼)/í µí¼
Equation II-3
The Weibull method (Equation II-4) is another commonly used distribution for modeling
extreme events. This distribution is characterized by two parameters, the shape parameter (í µí±)
and the scale parameter (í µí¼).
í µí°¹(í µí±¥; í µí±, λ) = 1 − í µí±
[−(
í µí±¥
λ
)
í µí±
]
Equation II-4
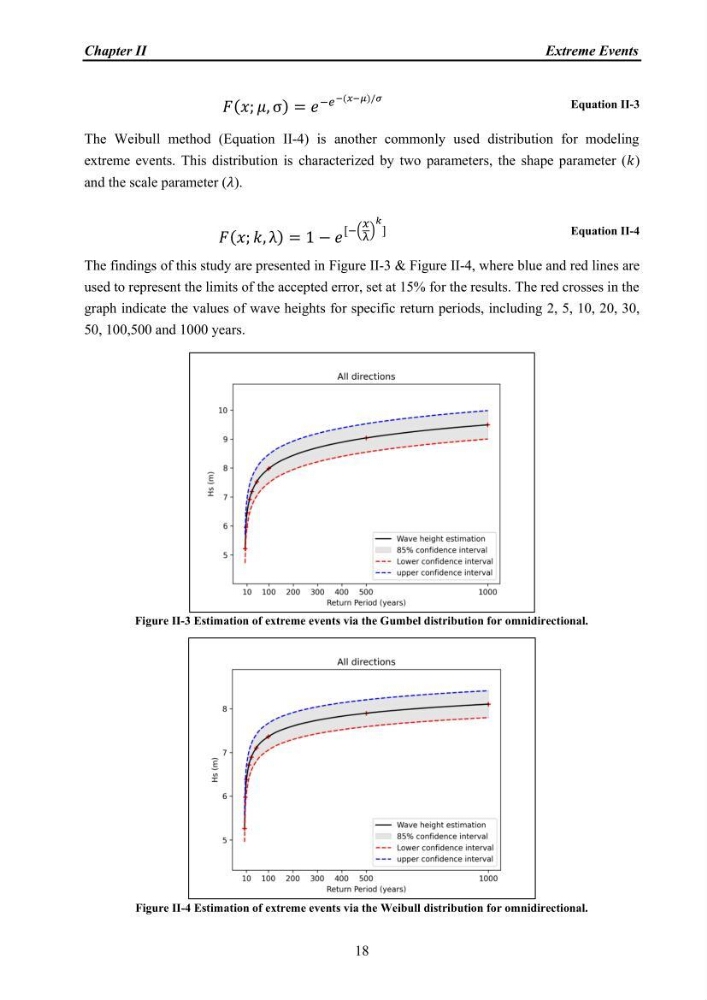
The findings of this study are presented in Figure II-3 & Figure II-4, where blue and red lines are
used to represent the limits of the accepted error, set at 15% for the results. The red crosses in the
graph indicate the values of wave heights for specific return periods, including 2, 5, 10, 20, 30,
50, 100,500 and 1000 years.
Figure II-3 Estimation of extreme events via the Gumbel distribution for omnidirectional.
Figure II-4 Estimation of extreme events via the Weibull distribution for omnidirectional.
Extreme Events
18
í µí°¹(í µí±¥; í µí¼, σ) = í µí±
−í µí± −(í µí±¥−í µí¼)/í µí¼
Equation II-3
The Weibull method (Equation II-4) is another commonly used distribution for modeling
extreme events. This distribution is characterized by two parameters, the shape parameter (í µí±)
and the scale parameter (í µí¼).
í µí°¹(í µí±¥; í µí±, λ) = 1 − í µí±
[−(
í µí±¥
λ
)
í µí±
]
Equation II-4
The findings of this study are presented in Figure II-3 & Figure II-4, where blue and red lines are
used to represent the limits of the accepted error, set at 15% for the results. The red crosses in the
graph indicate the values of wave heights for specific return periods, including 2, 5, 10, 20, 30,
50, 100,500 and 1000 years.
Figure II-3 Estimation of extreme events via the Gumbel distribution for omnidirectional.
Figure II-4 Estimation of extreme events via the Weibull distribution for omnidirectional.