

Chapter I
Climatological data for the study area
6
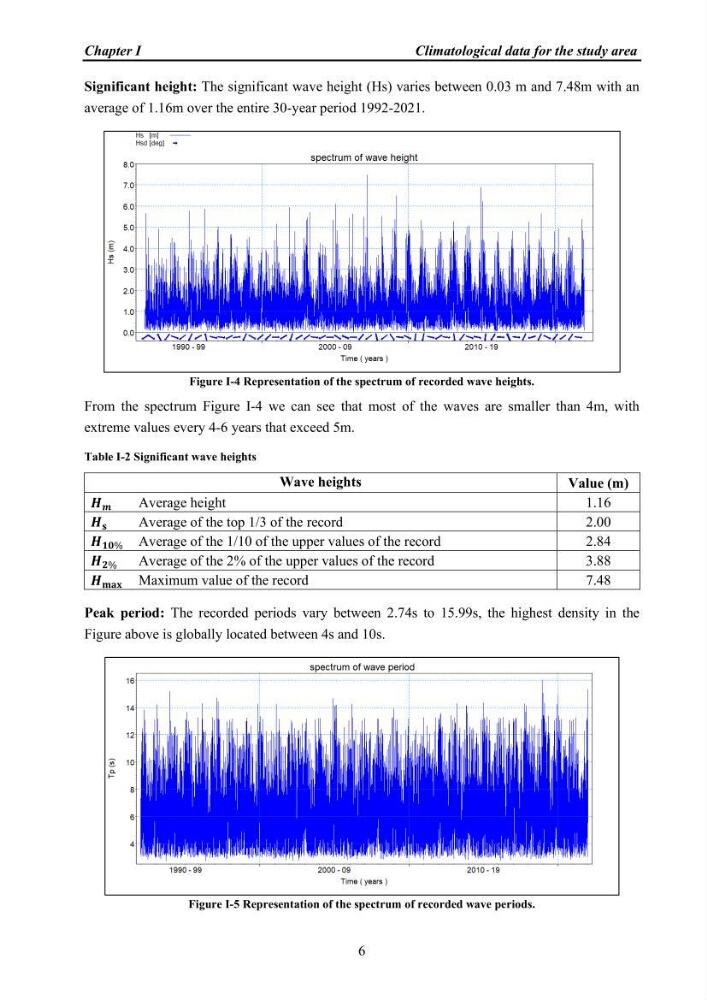
Significant height: The significant wave height (Hs) varies between 0.03 m and 7.48m with an
average of 1.16m over the entire 30-year period 1992-2021.
Figure I-4 Representation of the spectrum of recorded wave heights.
From the spectrum Figure I-4 we can see that most of the waves are smaller than 4m, with
extreme values every 4-6 years that exceed 5m.
Table I-2 Significant wave heights
Wave heights
Value (m)
í µí±¯ í µí²
Average height
1.16
í µí±¯ í µí°Average of the top 1/3 of the record
2.00
í µí±¯ í µí¿í µí¿% Average of the 1/10 of the upper values of the record
2.84
í µí±¯ í µí¿%
Average of the 2% of the upper values of the record
3.88
í µí±¯ í µí°¦í µí°í µí°± Maximum value of the record
7.48
Peak period: The recorded periods vary between 2.74s to 15.99s, the highest density in the
Figure above is globally located between 4s and 10s.
Figure I-5 Representation of the spectrum of recorded wave periods.
Climatological data for the study area
6
Significant height: The significant wave height (Hs) varies between 0.03 m and 7.48m with an
average of 1.16m over the entire 30-year period 1992-2021.
Figure I-4 Representation of the spectrum of recorded wave heights.
From the spectrum Figure I-4 we can see that most of the waves are smaller than 4m, with
extreme values every 4-6 years that exceed 5m.
Table I-2 Significant wave heights
Wave heights
Value (m)
í µí±¯ í µí²
Average height
1.16
í µí±¯ í µí°Average of the top 1/3 of the record
2.00
í µí±¯ í µí¿í µí¿% Average of the 1/10 of the upper values of the record
2.84
í µí±¯ í µí¿%
Average of the 2% of the upper values of the record
3.88
í µí±¯ í µí°¦í µí°í µí°± Maximum value of the record
7.48
Peak period: The recorded periods vary between 2.74s to 15.99s, the highest density in the
Figure above is globally located between 4s and 10s.
Figure I-5 Representation of the spectrum of recorded wave periods.