

7 Long-Term Trends in Sulfur and Reactive Nitrogen …
43
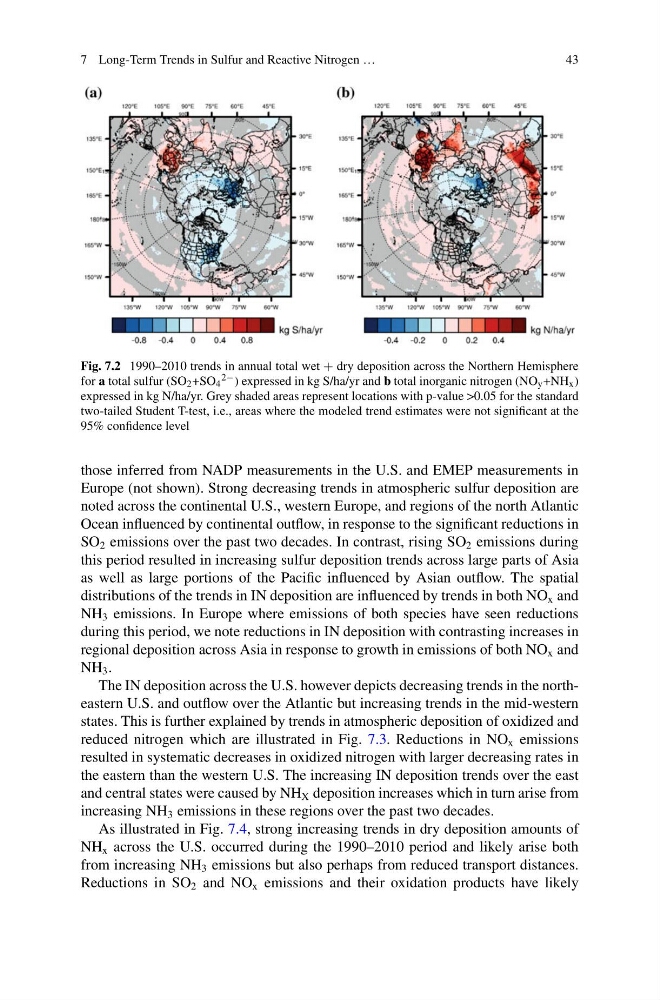
Fig. 7.2 1990–2010 trends in annual total wet + dry deposition across the Northern Hemisphere
for a total sulfur (SO 2 +SO 4
2− ) expressed in kg S/ha/yr and b total inorganic nitrogen (NO y +NH x )
expressed in kg N/ha/yr. Grey shaded areas represent locations with p-value >0.05 for the standard
two-tailed Student T-test, i.e., areas where the modeled trend estimates were not significant at the
95% confidence level
those inferred from NADP measurements in the U.S. and EMEP measurements in
Europe (not shown). Strong decreasing trends in atmospheric sulfur deposition are
noted across the continental U.S., western Europe, and regions of the north Atlantic
Ocean influenced by continental outflow, in response to the significant reductions in
SO 2 emissions over the past two decades. In contrast, rising SO 2 emissions during
this period resulted in increasing sulfur deposition trends across large parts of Asia
as well as large portions of the Pacific influenced by Asian outflow. The spatial
distributions of the trends in IN deposition are influenced by trends in both NO x and
NH 3 emissions. In Europe where emissions of both species have seen reductions
during this period, we note reductions in IN deposition with contrasting increases in
regional deposition across Asia in response to growth in emissions of both NO x and
NH 3 .
The IN deposition across the U.S. however depicts decreasing trends in the northeastern U.S. and outflow over the Atlantic but increasing trends in the mid-western
states. This is further explained by trends in atmospheric deposition of oxidized and
reduced nitrogen which are illustrated in Fig. 7.3. Reductions in NO x emissions
resulted in systematic decreases in oxidized nitrogen with larger decreasing rates in
the eastern than the western U.S. The increasing IN deposition trends over the east
and central states were caused by NH X deposition increases which in turn arise from
increasing NH 3 emissions in these regions over the past two decades.
As illustrated in Fig. 7.4, strong increasing trends in dry deposition amounts of
NH x across the U.S. occurred during the 1990–2010 period and likely arise both
from increasing NH 3 emissions but also perhaps from reduced transport distances.
Reductions in SO 2 and NO x emissions and their oxidation products have likely
43
Fig. 7.2 1990–2010 trends in annual total wet + dry deposition across the Northern Hemisphere
for a total sulfur (SO 2 +SO 4
2− ) expressed in kg S/ha/yr and b total inorganic nitrogen (NO y +NH x )
expressed in kg N/ha/yr. Grey shaded areas represent locations with p-value >0.05 for the standard
two-tailed Student T-test, i.e., areas where the modeled trend estimates were not significant at the
95% confidence level
those inferred from NADP measurements in the U.S. and EMEP measurements in
Europe (not shown). Strong decreasing trends in atmospheric sulfur deposition are
noted across the continental U.S., western Europe, and regions of the north Atlantic
Ocean influenced by continental outflow, in response to the significant reductions in
SO 2 emissions over the past two decades. In contrast, rising SO 2 emissions during
this period resulted in increasing sulfur deposition trends across large parts of Asia
as well as large portions of the Pacific influenced by Asian outflow. The spatial
distributions of the trends in IN deposition are influenced by trends in both NO x and
NH 3 emissions. In Europe where emissions of both species have seen reductions
during this period, we note reductions in IN deposition with contrasting increases in
regional deposition across Asia in response to growth in emissions of both NO x and
NH 3 .
The IN deposition across the U.S. however depicts decreasing trends in the northeastern U.S. and outflow over the Atlantic but increasing trends in the mid-western
states. This is further explained by trends in atmospheric deposition of oxidized and
reduced nitrogen which are illustrated in Fig. 7.3. Reductions in NO x emissions
resulted in systematic decreases in oxidized nitrogen with larger decreasing rates in
the eastern than the western U.S. The increasing IN deposition trends over the east
and central states were caused by NH X deposition increases which in turn arise from
increasing NH 3 emissions in these regions over the past two decades.
As illustrated in Fig. 7.4, strong increasing trends in dry deposition amounts of
NH x across the U.S. occurred during the 1990–2010 period and likely arise both
from increasing NH 3 emissions but also perhaps from reduced transport distances.
Reductions in SO 2 and NO x emissions and their oxidation products have likely