

44
R. Mathur et al.
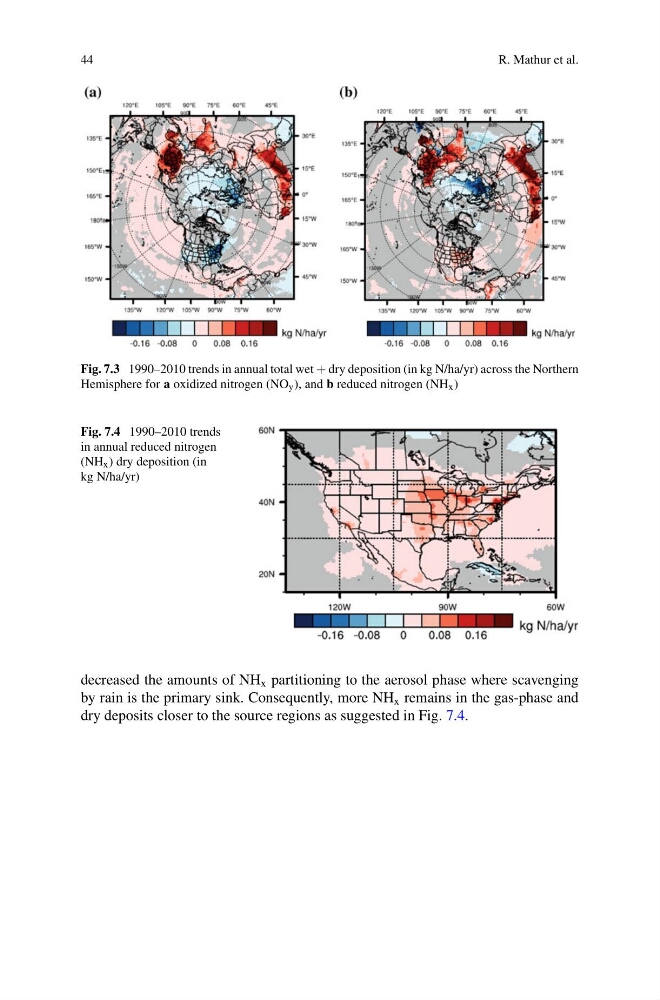
Fig. 7.3 1990–2010 trends in annual total wet + dry deposition (in kg N/ha/yr) across the Northern
Hemisphere for a oxidized nitrogen (NO y ), and b reduced nitrogen (NH x )
Fig. 7.4 1990–2010 trends
in annual reduced nitrogen
(NH x ) dry deposition (in
kg N/ha/yr)
decreased the amounts of NH x partitioning to the aerosol phase where scavenging
by rain is the primary sink. Consequently, more NH x remains in the gas-phase and
dry deposits closer to the source regions as suggested in Fig. 7.4.
R. Mathur et al.
Fig. 7.3 1990–2010 trends in annual total wet + dry deposition (in kg N/ha/yr) across the Northern
Hemisphere for a oxidized nitrogen (NO y ), and b reduced nitrogen (NH x )
Fig. 7.4 1990–2010 trends
in annual reduced nitrogen
(NH x ) dry deposition (in
kg N/ha/yr)
decreased the amounts of NH x partitioning to the aerosol phase where scavenging
by rain is the primary sink. Consequently, more NH x remains in the gas-phase and
dry deposits closer to the source regions as suggested in Fig. 7.4.