

3 Unravelling the Origin of High Ozone Concentrations …
19
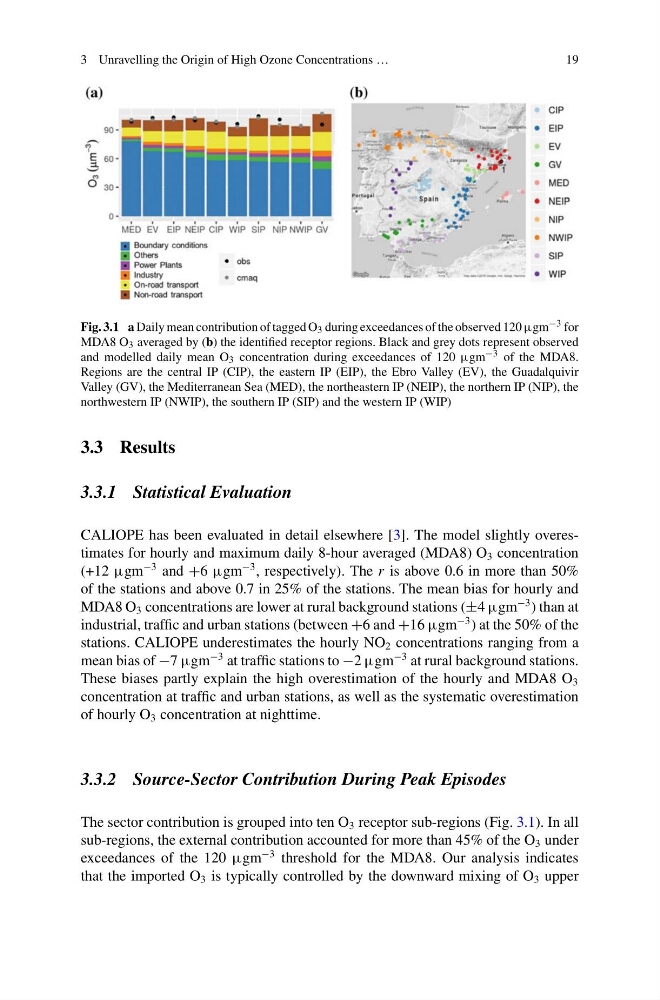
Fig. 3.1 a Daily mean contribution of tagged O 3 during exceedances of the observed 120 µgm −3 for
MDA8 O 3 averaged by (b) the identified receptor regions. Black and grey dots represent observed
and modelled daily mean O 3 concentration during exceedances of 120 µgm −3 of the MDA8.
Regions are the central IP (CIP), the eastern IP (EIP), the Ebro Valley (EV), the Guadalquivir
Valley (GV), the Mediterranean Sea (MED), the northeastern IP (NEIP), the northern IP (NIP), the
northwestern IP (NWIP), the southern IP (SIP) and the western IP (WIP)
3.3 Results
3.3.1 Statistical Evaluation
CALIOPE has been evaluated in detail elsewhere [3]. The model slightly overestimates for hourly and maximum daily 8-hour averaged (MDA8) O 3 concentration
(+12 µgm
−3 and +6 µgm
−3 , respectively). The r is above 0.6 in more than 50%
of the stations and above 0.7 in 25% of the stations. The mean bias for hourly and
MDA8 O 3 concentrations are lower at rural background stations (±4 µgm
−3 ) than at
industrial, traffic and urban stations (between +6 and +16 µgm
−3 ) at the 50% of the
stations. CALIOPE underestimates the hourly NO 2 concentrations ranging from a
mean bias of −7 µgm
−3 at traffic stations to −2 µgm
−3 at rural background stations.
These biases partly explain the high overestimation of the hourly and MDA8 O 3
concentration at traffic and urban stations, as well as the systematic overestimation
of hourly O 3 concentration at nighttime.
3.3.2 Source-Sector Contribution During Peak Episodes
The sector contribution is grouped into ten O 3 receptor sub-regions (Fig. 3.1). In all
sub-regions, the external contribution accounted for more than 45% of the O 3 under
exceedances of the 120 µgm
−3 threshold for the MDA8. Our analysis indicates
that the imported O 3 is typically controlled by the downward mixing of O 3 upper
19
Fig. 3.1 a Daily mean contribution of tagged O 3 during exceedances of the observed 120 µgm −3 for
MDA8 O 3 averaged by (b) the identified receptor regions. Black and grey dots represent observed
and modelled daily mean O 3 concentration during exceedances of 120 µgm −3 of the MDA8.
Regions are the central IP (CIP), the eastern IP (EIP), the Ebro Valley (EV), the Guadalquivir
Valley (GV), the Mediterranean Sea (MED), the northeastern IP (NEIP), the northern IP (NIP), the
northwestern IP (NWIP), the southern IP (SIP) and the western IP (WIP)
3.3 Results
3.3.1 Statistical Evaluation
CALIOPE has been evaluated in detail elsewhere [3]. The model slightly overestimates for hourly and maximum daily 8-hour averaged (MDA8) O 3 concentration
(+12 µgm
−3 and +6 µgm
−3 , respectively). The r is above 0.6 in more than 50%
of the stations and above 0.7 in 25% of the stations. The mean bias for hourly and
MDA8 O 3 concentrations are lower at rural background stations (±4 µgm
−3 ) than at
industrial, traffic and urban stations (between +6 and +16 µgm
−3 ) at the 50% of the
stations. CALIOPE underestimates the hourly NO 2 concentrations ranging from a
mean bias of −7 µgm
−3 at traffic stations to −2 µgm
−3 at rural background stations.
These biases partly explain the high overestimation of the hourly and MDA8 O 3
concentration at traffic and urban stations, as well as the systematic overestimation
of hourly O 3 concentration at nighttime.
3.3.2 Source-Sector Contribution During Peak Episodes
The sector contribution is grouped into ten O 3 receptor sub-regions (Fig. 3.1). In all
sub-regions, the external contribution accounted for more than 45% of the O 3 under
exceedances of the 120 µgm
−3 threshold for the MDA8. Our analysis indicates
that the imported O 3 is typically controlled by the downward mixing of O 3 upper