

20
M. T. Pay et al.
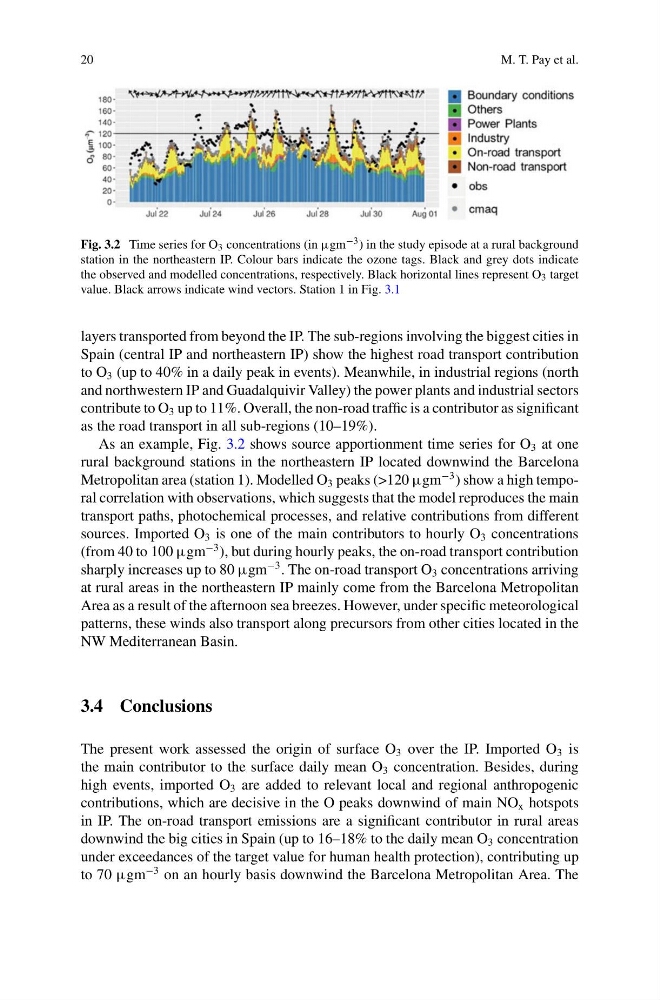
Fig. 3.2 Time series for O 3 concentrations (in µgm −3 ) in the study episode at a rural background
station in the northeastern IP. Colour bars indicate the ozone tags. Black and grey dots indicate
the observed and modelled concentrations, respectively. Black horizontal lines represent O 3 target
value. Black arrows indicate wind vectors. Station 1 in Fig. 3.1
layers transported from beyond the IP. The sub-regions involving the biggest cities in
Spain (central IP and northeastern IP) show the highest road transport contribution
to O 3 (up to 40% in a daily peak in events). Meanwhile, in industrial regions (north
and northwestern IP and Guadalquivir Valley) the power plants and industrial sectors
contribute to O 3 up to 11%. Overall, the non-road traffic is a contributor as significant
as the road transport in all sub-regions (10–19%).
As an example, Fig. 3.2 shows source apportionment time series for O 3 at one
rural background stations in the northeastern IP located downwind the Barcelona
Metropolitan area (station 1). Modelled O 3 peaks (>120 µgm
−3 ) show a high temporal correlation with observations, which suggests that the model reproduces the main
transport paths, photochemical processes, and relative contributions from different
sources. Imported O 3 is one of the main contributors to hourly O 3 concentrations
(from 40 to 100 µgm
−3 ), but during hourly peaks, the on-road transport contribution
sharply increases up to 80 µgm
−3 . The on-road transport O 3 concentrations arriving
at rural areas in the northeastern IP mainly come from the Barcelona Metropolitan
Area as a result of the afternoon sea breezes. However, under specific meteorological
patterns, these winds also transport along precursors from other cities located in the
NW Mediterranean Basin.
3.4 Conclusions
The present work assessed the origin of surface O 3 over the IP. Imported O 3 is
the main contributor to the surface daily mean O 3 concentration. Besides, during
high events, imported O 3 are added to relevant local and regional anthropogenic
contributions, which are decisive in the O peaks downwind of main NO x hotspots
in IP. The on-road transport emissions are a significant contributor in rural areas
downwind the big cities in Spain (up to 16–18% to the daily mean O 3 concentration
under exceedances of the target value for human health protection), contributing up
to 70 µgm
−3 on an hourly basis downwind the Barcelona Metropolitan Area. The
M. T. Pay et al.
Fig. 3.2 Time series for O 3 concentrations (in µgm −3 ) in the study episode at a rural background
station in the northeastern IP. Colour bars indicate the ozone tags. Black and grey dots indicate
the observed and modelled concentrations, respectively. Black horizontal lines represent O 3 target
value. Black arrows indicate wind vectors. Station 1 in Fig. 3.1
layers transported from beyond the IP. The sub-regions involving the biggest cities in
Spain (central IP and northeastern IP) show the highest road transport contribution
to O 3 (up to 40% in a daily peak in events). Meanwhile, in industrial regions (north
and northwestern IP and Guadalquivir Valley) the power plants and industrial sectors
contribute to O 3 up to 11%. Overall, the non-road traffic is a contributor as significant
as the road transport in all sub-regions (10–19%).
As an example, Fig. 3.2 shows source apportionment time series for O 3 at one
rural background stations in the northeastern IP located downwind the Barcelona
Metropolitan area (station 1). Modelled O 3 peaks (>120 µgm
−3 ) show a high temporal correlation with observations, which suggests that the model reproduces the main
transport paths, photochemical processes, and relative contributions from different
sources. Imported O 3 is one of the main contributors to hourly O 3 concentrations
(from 40 to 100 µgm
−3 ), but during hourly peaks, the on-road transport contribution
sharply increases up to 80 µgm
−3 . The on-road transport O 3 concentrations arriving
at rural areas in the northeastern IP mainly come from the Barcelona Metropolitan
Area as a result of the afternoon sea breezes. However, under specific meteorological
patterns, these winds also transport along precursors from other cities located in the
NW Mediterranean Basin.
3.4 Conclusions
The present work assessed the origin of surface O 3 over the IP. Imported O 3 is
the main contributor to the surface daily mean O 3 concentration. Besides, during
high events, imported O 3 are added to relevant local and regional anthropogenic
contributions, which are decisive in the O peaks downwind of main NO x hotspots
in IP. The on-road transport emissions are a significant contributor in rural areas
downwind the big cities in Spain (up to 16–18% to the daily mean O 3 concentration
under exceedances of the target value for human health protection), contributing up
to 70 µgm
−3 on an hourly basis downwind the Barcelona Metropolitan Area. The