

74 Using Multi-media Modeling to Investigate Conditions …
471
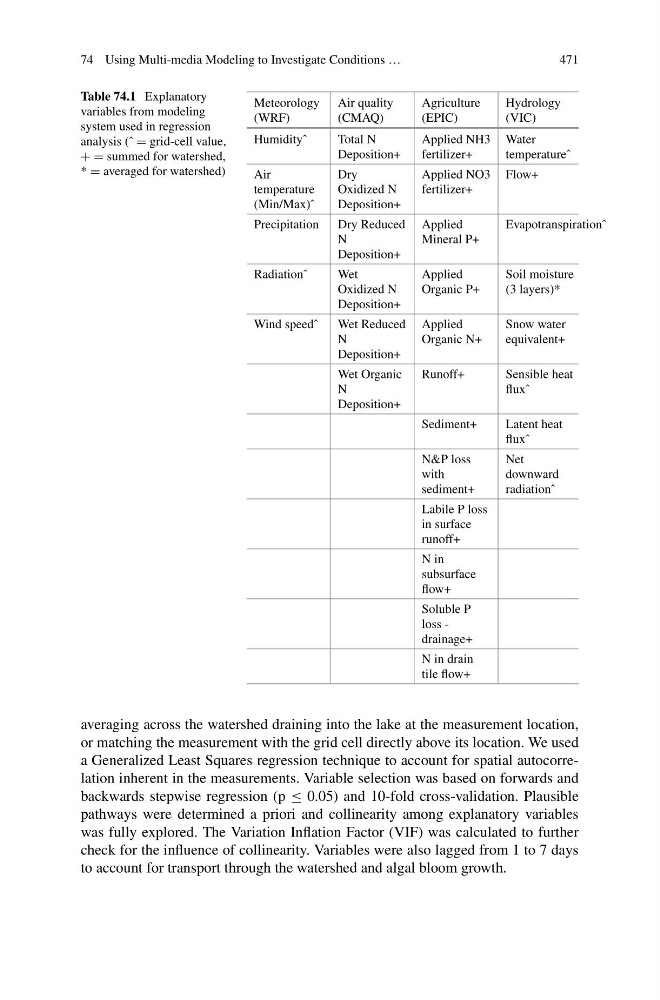
Table 74.1 Explanatory
variables from modeling
system used in regression
analysis (ˆ = grid-cell value,
+ = summed for watershed,
* = averaged for watershed)
Meteorology
(WRF)
Air quality
(CMAQ)
Agriculture
(EPIC)
Hydrology
(VIC)
Humidityˆ
Total N
Deposition+
Applied NH3
fertilizer+
Water
temperatureˆ
Air
temperature
(Min/Max)ˆ
Dry
Oxidized N
Deposition+
Applied NO3
fertilizer+
Flow+
Precipitation Dry Reduced
N
Deposition+
Applied
Mineral P+
Evapotranspirationˆ
Radiationˆ
Wet
Oxidized N
Deposition+
Applied
Organic P+
Soil moisture
(3 layers)*
Wind speedˆ
Wet Reduced
N
Deposition+
Applied
Organic N+
Snow water
equivalent+
Wet Organic
N
Deposition+
Runoff+
Sensible heat
fluxˆ
Sediment+
Latent heat
fluxˆ
N&P loss
with
sediment+
Net
downward
radiationˆ
Labile P loss
in surface
runoff+
N in
subsurface
flow+
Soluble P
loss -
drainage+
N in drain
tile flow+
averaging across the watershed draining into the lake at the measurement location,
or matching the measurement with the grid cell directly above its location. We used
a Generalized Least Squares regression technique to account for spatial autocorrelation inherent in the measurements. Variable selection was based on forwards and
backwards stepwise regression (p ≤ 0.05) and 10-fold cross-validation. Plausible
pathways were determined a priori and collinearity among explanatory variables
was fully explored. The Variation Inflation Factor (VIF) was calculated to further
check for the influence of collinearity. Variables were also lagged from 1 to 7 days
to account for transport through the watershed and algal bloom growth.
471
Table 74.1 Explanatory
variables from modeling
system used in regression
analysis (ˆ = grid-cell value,
+ = summed for watershed,
* = averaged for watershed)
Meteorology
(WRF)
Air quality
(CMAQ)
Agriculture
(EPIC)
Hydrology
(VIC)
Humidityˆ
Total N
Deposition+
Applied NH3
fertilizer+
Water
temperatureˆ
Air
temperature
(Min/Max)ˆ
Dry
Oxidized N
Deposition+
Applied NO3
fertilizer+
Flow+
Precipitation Dry Reduced
N
Deposition+
Applied
Mineral P+
Evapotranspirationˆ
Radiationˆ
Wet
Oxidized N
Deposition+
Applied
Organic P+
Soil moisture
(3 layers)*
Wind speedˆ
Wet Reduced
N
Deposition+
Applied
Organic N+
Snow water
equivalent+
Wet Organic
N
Deposition+
Runoff+
Sensible heat
fluxˆ
Sediment+
Latent heat
fluxˆ
N&P loss
with
sediment+
Net
downward
radiationˆ
Labile P loss
in surface
runoff+
N in
subsurface
flow+
Soluble P
loss -
drainage+
N in drain
tile flow+
averaging across the watershed draining into the lake at the measurement location,
or matching the measurement with the grid cell directly above its location. We used
a Generalized Least Squares regression technique to account for spatial autocorrelation inherent in the measurements. Variable selection was based on forwards and
backwards stepwise regression (p ≤ 0.05) and 10-fold cross-validation. Plausible
pathways were determined a priori and collinearity among explanatory variables
was fully explored. The Variation Inflation Factor (VIF) was calculated to further
check for the influence of collinearity. Variables were also lagged from 1 to 7 days
to account for transport through the watershed and algal bloom growth.