

470
V. Garcia et al.
74.2 Approach
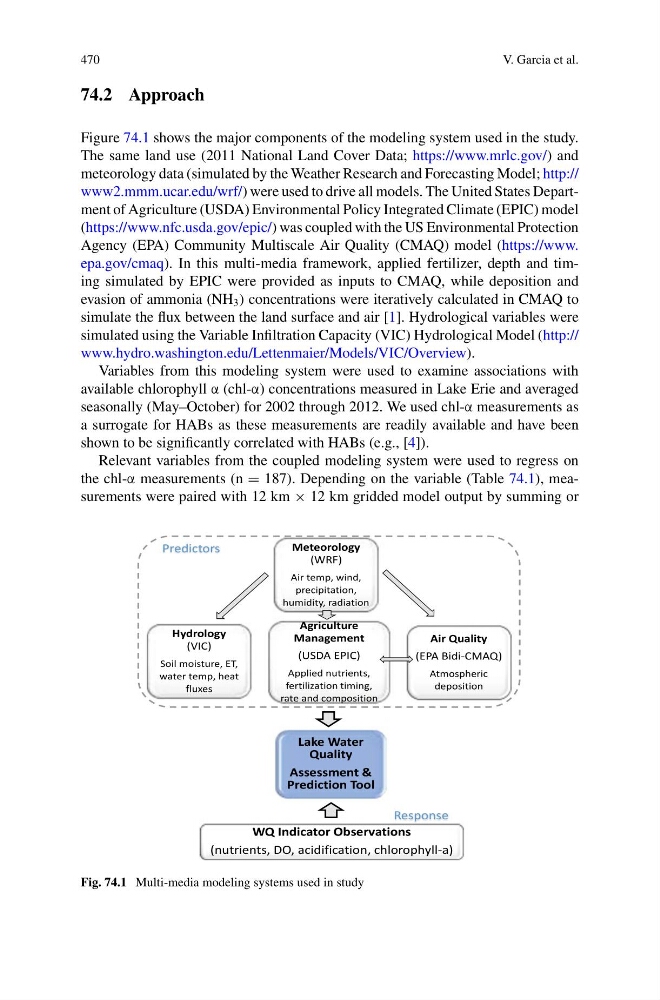
Figure 74.1 shows the major components of the modeling system used in the study.
The same land use (2011 National Land Cover Data; https://www.mrlc.gov/) and
meteorology data (simulated by the Weather Research and Forecasting Model; http://
www2.mmm.ucar.edu/wrf/) were used to drive all models. The United States Department of Agriculture (USDA) Environmental Policy Integrated Climate (EPIC) model
(https://www.nfc.usda.gov/epic/) was coupled with the US Environmental Protection
Agency (EPA) Community Multiscale Air Quality (CMAQ) model (https://www.
epa.gov/cmaq). In this multi-media framework, applied fertilizer, depth and timing simulated by EPIC were provided as inputs to CMAQ, while deposition and
evasion of ammonia (NH 3 ) concentrations were iteratively calculated in CMAQ to
simulate the flux between the land surface and air [1]. Hydrological variables were
simulated using the Variable Infiltration Capacity (VIC) Hydrological Model (http://
www.hydro.washington.edu/Lettenmaier/Models/VIC/Overview).
Variables from this modeling system were used to examine associations with
available chlorophyll α (chl-α) concentrations measured in Lake Erie and averaged
seasonally (May–October) for 2002 through 2012. We used chl-α measurements as
a surrogate for HABs as these measurements are readily available and have been
shown to be significantly correlated with HABs (e.g., [4]).
Relevant variables from the coupled modeling system were used to regress on
the chl-α measurements (n = 187). Depending on the variable (Table 74.1), measurements were paired with 12 km × 12 km gridded model output by summing or
Lake Water
Quality
Assessment &
Prediction Tool
Air Quality
(EPA Bidi-CMAQ)
Atmospheric
deposition
Meteorology
(WRF)
Air temp, wind,
precipitation,
humidity, radiation
Hydrology
(VIC)
Soil moisture, ET,
water temp, heat
fluxes
Agriculture
Management
(USDA EPIC)
Applied nutrients,
fertilization timing,
rate and composition
WQ Indicator Observations
(nutrients, DO, acidification, chlorophyll-a)
Predictors
Response
Fig. 74.1 Multi-media modeling systems used in study
V. Garcia et al.
74.2 Approach
Figure 74.1 shows the major components of the modeling system used in the study.
The same land use (2011 National Land Cover Data; https://www.mrlc.gov/) and
meteorology data (simulated by the Weather Research and Forecasting Model; http://
www2.mmm.ucar.edu/wrf/) were used to drive all models. The United States Department of Agriculture (USDA) Environmental Policy Integrated Climate (EPIC) model
(https://www.nfc.usda.gov/epic/) was coupled with the US Environmental Protection
Agency (EPA) Community Multiscale Air Quality (CMAQ) model (https://www.
epa.gov/cmaq). In this multi-media framework, applied fertilizer, depth and timing simulated by EPIC were provided as inputs to CMAQ, while deposition and
evasion of ammonia (NH 3 ) concentrations were iteratively calculated in CMAQ to
simulate the flux between the land surface and air [1]. Hydrological variables were
simulated using the Variable Infiltration Capacity (VIC) Hydrological Model (http://
www.hydro.washington.edu/Lettenmaier/Models/VIC/Overview).
Variables from this modeling system were used to examine associations with
available chlorophyll α (chl-α) concentrations measured in Lake Erie and averaged
seasonally (May–October) for 2002 through 2012. We used chl-α measurements as
a surrogate for HABs as these measurements are readily available and have been
shown to be significantly correlated with HABs (e.g., [4]).
Relevant variables from the coupled modeling system were used to regress on
the chl-α measurements (n = 187). Depending on the variable (Table 74.1), measurements were paired with 12 km × 12 km gridded model output by summing or
Lake Water
Quality
Assessment &
Prediction Tool
Air Quality
(EPA Bidi-CMAQ)
Atmospheric
deposition
Meteorology
(WRF)
Air temp, wind,
precipitation,
humidity, radiation
Hydrology
(VIC)
Soil moisture, ET,
water temp, heat
fluxes
Agriculture
Management
(USDA EPIC)
Applied nutrients,
fertilization timing,
rate and composition
WQ Indicator Observations
(nutrients, DO, acidification, chlorophyll-a)
Predictors
Response
Fig. 74.1 Multi-media modeling systems used in study