

472
V. Garcia et al.
In addition, we used a machine learning Random Forest technique to examine the
most influential variables for predicting chl-α concentrations. This metric was calculated by permuting the variable multiple times and calculating the percent increase
in the mean square error.
74.3 Results and Discussion
We found that evapotranspiration (3-day lag, grid-cell value), total ammonia fertilizer
applied to crops (2-day lag, watershed), deep soil moisture (4-day lag, watershed),
radiation (3-day lag, grid-cell value) and dry deposited oxidized nitrogen (5-day
lag, watershed) were significantly associated with chl-α measurements. Significant
variables from regression modeling fell within the top 20 most influential variables
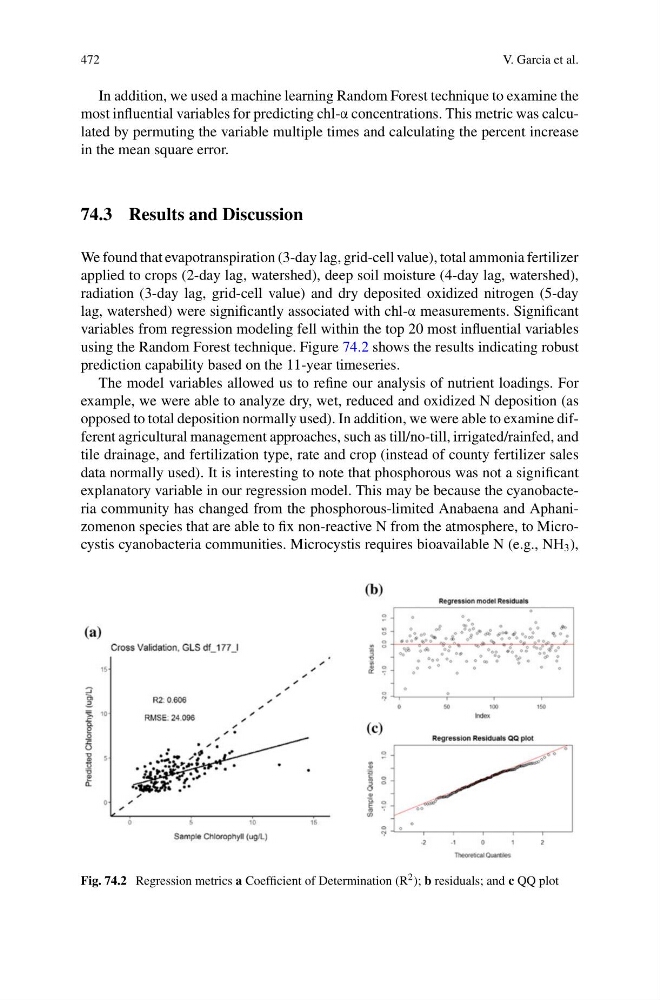
using the Random Forest technique. Figure 74.2 shows the results indicating robust
prediction capability based on the 11-year timeseries.
The model variables allowed us to refine our analysis of nutrient loadings. For
example, we were able to analyze dry, wet, reduced and oxidized N deposition (as
opposed to total deposition normally used). In addition, we were able to examine different agricultural management approaches, such as till/no-till, irrigated/rainfed, and
tile drainage, and fertilization type, rate and crop (instead of county fertilizer sales
data normally used). It is interesting to note that phosphorous was not a significant
explanatory variable in our regression model. This may be because the cyanobacteria community has changed from the phosphorous-limited Anabaena and Aphanizomenon species that are able to fix non-reactive N from the atmosphere, to Microcystis cyanobacteria communities. Microcystis requires bioavailable N (e.g., NH 3 ),
Fig. 74.2 Regression metrics a Coefficient of Determination (R 2 ); b residuals; and c QQ plot
V. Garcia et al.
In addition, we used a machine learning Random Forest technique to examine the
most influential variables for predicting chl-α concentrations. This metric was calculated by permuting the variable multiple times and calculating the percent increase
in the mean square error.
74.3 Results and Discussion
We found that evapotranspiration (3-day lag, grid-cell value), total ammonia fertilizer
applied to crops (2-day lag, watershed), deep soil moisture (4-day lag, watershed),
radiation (3-day lag, grid-cell value) and dry deposited oxidized nitrogen (5-day
lag, watershed) were significantly associated with chl-α measurements. Significant
variables from regression modeling fell within the top 20 most influential variables
using the Random Forest technique. Figure 74.2 shows the results indicating robust
prediction capability based on the 11-year timeseries.
The model variables allowed us to refine our analysis of nutrient loadings. For
example, we were able to analyze dry, wet, reduced and oxidized N deposition (as
opposed to total deposition normally used). In addition, we were able to examine different agricultural management approaches, such as till/no-till, irrigated/rainfed, and
tile drainage, and fertilization type, rate and crop (instead of county fertilizer sales
data normally used). It is interesting to note that phosphorous was not a significant
explanatory variable in our regression model. This may be because the cyanobacteria community has changed from the phosphorous-limited Anabaena and Aphanizomenon species that are able to fix non-reactive N from the atmosphere, to Microcystis cyanobacteria communities. Microcystis requires bioavailable N (e.g., NH 3 ),
Fig. 74.2 Regression metrics a Coefficient of Determination (R 2 ); b residuals; and c QQ plot