

72 Assessing Potential Climate Change Impacts on Local Air …
455
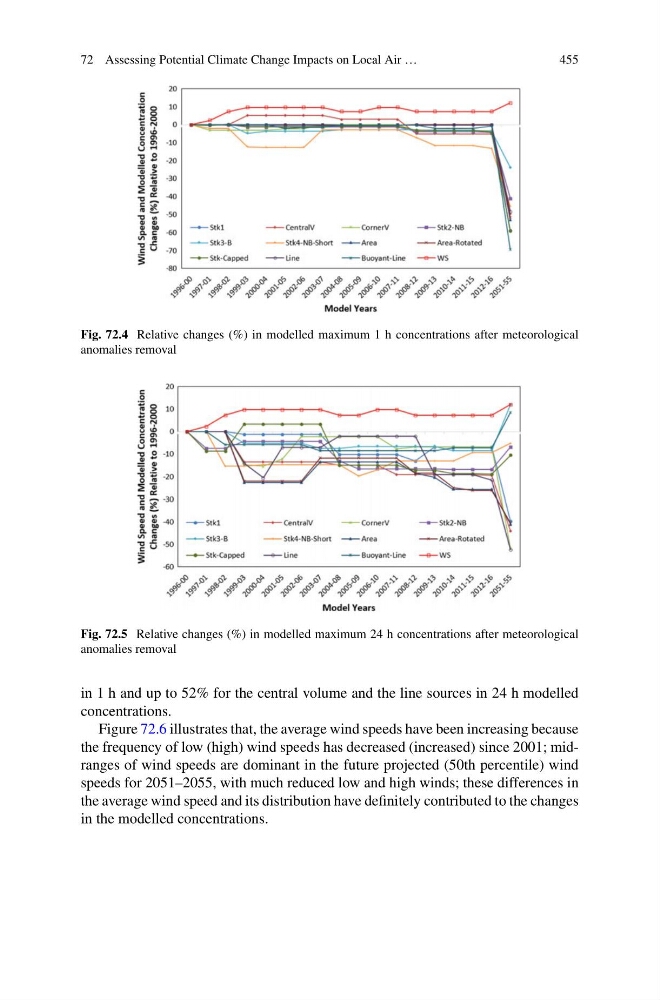
Fig. 72.4 Relative changes (%) in modelled maximum 1 h concentrations after meteorological
anomalies removal
Fig. 72.5 Relative changes (%) in modelled maximum 24 h concentrations after meteorological
anomalies removal
in 1 h and up to 52% for the central volume and the line sources in 24 h modelled
concentrations.
Figure 72.6 illustrates that, the average wind speeds have been increasing because
the frequency of low (high) wind speeds has decreased (increased) since 2001; midranges of wind speeds are dominant in the future projected (50th percentile) wind
speeds for 2051–2055, with much reduced low and high winds; these differences in
the average wind speed and its distribution have definitely contributed to the changes
in the modelled concentrations.
455
Fig. 72.4 Relative changes (%) in modelled maximum 1 h concentrations after meteorological
anomalies removal
Fig. 72.5 Relative changes (%) in modelled maximum 24 h concentrations after meteorological
anomalies removal
in 1 h and up to 52% for the central volume and the line sources in 24 h modelled
concentrations.
Figure 72.6 illustrates that, the average wind speeds have been increasing because
the frequency of low (high) wind speeds has decreased (increased) since 2001; midranges of wind speeds are dominant in the future projected (50th percentile) wind
speeds for 2051–2055, with much reduced low and high winds; these differences in
the average wind speed and its distribution have definitely contributed to the changes
in the modelled concentrations.