

454
J. Liu et al.
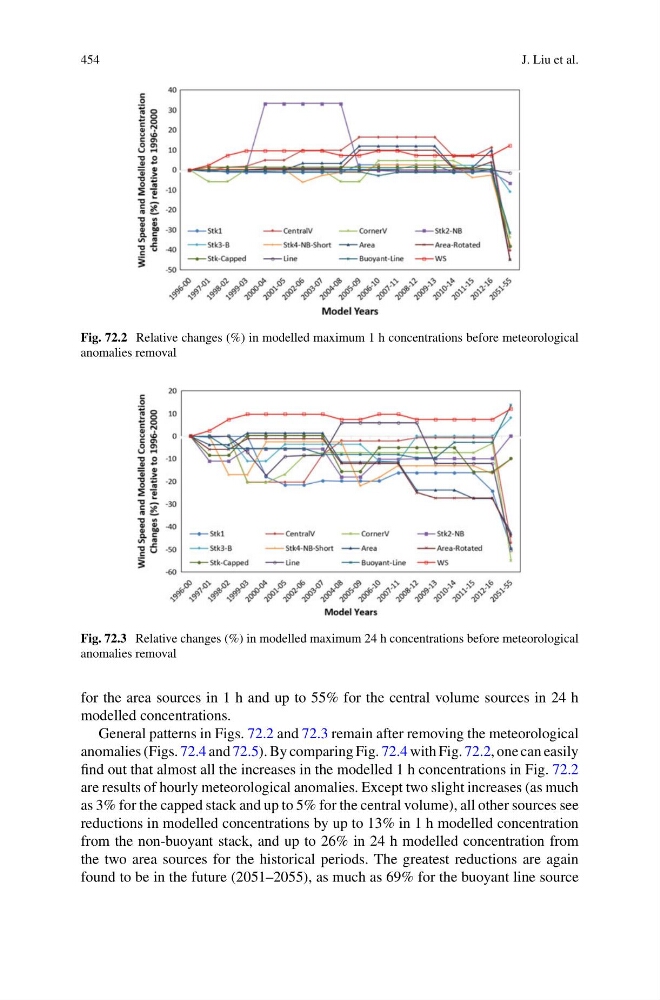
Fig. 72.2 Relative changes (%) in modelled maximum 1 h concentrations before meteorological
anomalies removal
Fig. 72.3 Relative changes (%) in modelled maximum 24 h concentrations before meteorological
anomalies removal
for the area sources in 1 h and up to 55% for the central volume sources in 24 h
modelled concentrations.
General patterns in Figs. 72.2 and 72.3 remain after removing the meteorological
anomalies (Figs. 72.4 and 72.5). By comparing Fig. 72.4 with Fig. 72.2, one can easily
find out that almost all the increases in the modelled 1 h concentrations in Fig. 72.2
are results of hourly meteorological anomalies. Except two slight increases (as much
as 3% for the capped stack and up to 5% for the central volume), all other sources see
reductions in modelled concentrations by up to 13% in 1 h modelled concentration
from the non-buoyant stack, and up to 26% in 24 h modelled concentration from
the two area sources for the historical periods. The greatest reductions are again
found to be in the future (2051–2055), as much as 69% for the buoyant line source
J. Liu et al.
Fig. 72.2 Relative changes (%) in modelled maximum 1 h concentrations before meteorological
anomalies removal
Fig. 72.3 Relative changes (%) in modelled maximum 24 h concentrations before meteorological
anomalies removal
for the area sources in 1 h and up to 55% for the central volume sources in 24 h
modelled concentrations.
General patterns in Figs. 72.2 and 72.3 remain after removing the meteorological
anomalies (Figs. 72.4 and 72.5). By comparing Fig. 72.4 with Fig. 72.2, one can easily
find out that almost all the increases in the modelled 1 h concentrations in Fig. 72.2
are results of hourly meteorological anomalies. Except two slight increases (as much
as 3% for the capped stack and up to 5% for the central volume), all other sources see
reductions in modelled concentrations by up to 13% in 1 h modelled concentration
from the non-buoyant stack, and up to 26% in 24 h modelled concentration from
the two area sources for the historical periods. The greatest reductions are again
found to be in the future (2051–2055), as much as 69% for the buoyant line source