

410
W. Gong et al.
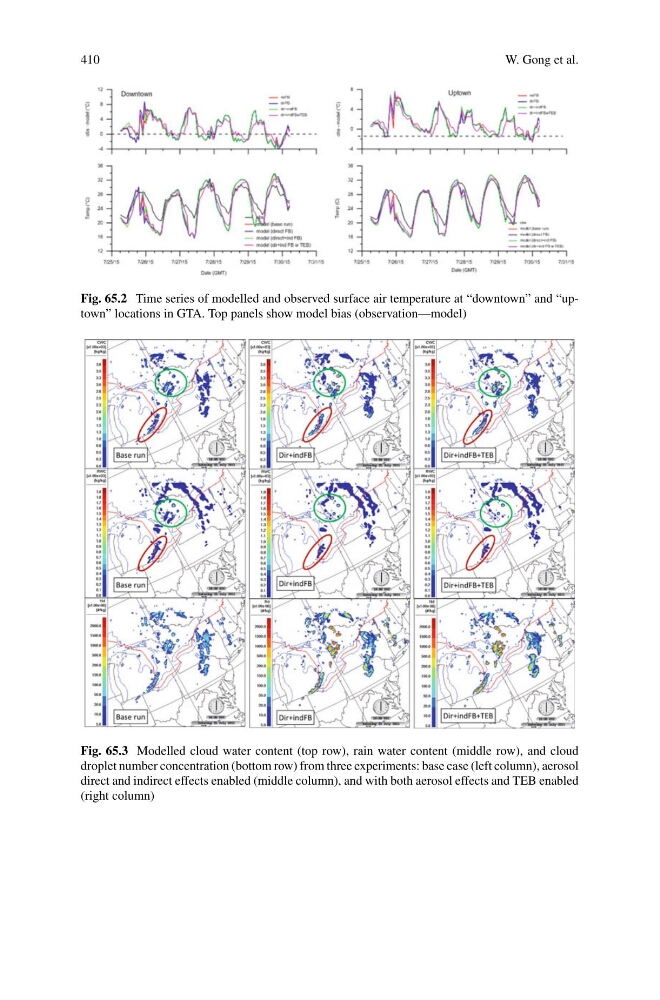
Fig. 65.2 Time series of modelled and observed surface air temperature at “downtown” and “uptown” locations in GTA. Top panels show model bias (observation—model)
Fig. 65.3 Modelled cloud water content (top row), rain water content (middle row), and cloud
droplet number concentration (bottom row) from three experiments: base case (left column), aerosol
direct and indirect effects enabled (middle column), and with both aerosol effects and TEB enabled
(right column)
W. Gong et al.
Fig. 65.2 Time series of modelled and observed surface air temperature at “downtown” and “uptown” locations in GTA. Top panels show model bias (observation—model)
Fig. 65.3 Modelled cloud water content (top row), rain water content (middle row), and cloud
droplet number concentration (bottom row) from three experiments: base case (left column), aerosol
direct and indirect effects enabled (middle column), and with both aerosol effects and TEB enabled
(right column)