

380
R. Wolke et al.
60.3 Results and Discussion
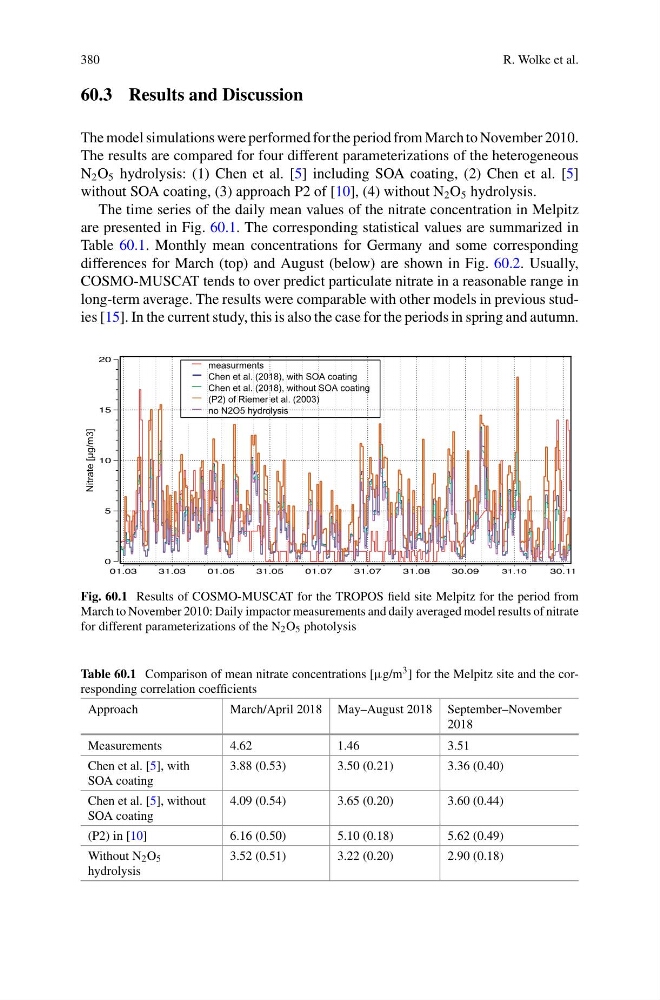
The model simulations were performed for the period from March to November 2010.
The results are compared for four different parameterizations of the heterogeneous
N 2 O 5 hydrolysis: (1) Chen et al. [5] including SOA coating, (2) Chen et al. [5]
without SOA coating, (3) approach P2 of [10], (4) without N 2 O 5 hydrolysis.
The time series of the daily mean values of the nitrate concentration in Melpitz
are presented in Fig. 60.1. The corresponding statistical values are summarized in
Table 60.1. Monthly mean concentrations for Germany and some corresponding
differences for March (top) and August (below) are shown in Fig. 60.2. Usually,
COSMO-MUSCAT tends to over predict particulate nitrate in a reasonable range in
long-term average. The results were comparable with other models in previous studies [15]. In the current study, this is also the case for the periods in spring and autumn.
Nitrate [µg/m3]
Chen et al. (2018), with SOA coating
Chen et al. (2018), without SOA coating
(P2) of Riemer et al. (2003)
no N2O5 hydrolysis
measurments
Fig. 60.1 Results of COSMO-MUSCAT for the TROPOS field site Melpitz for the period from
March to November 2010: Daily impactor measurements and daily averaged model results of nitrate
for different parameterizations of the N 2 O 5 photolysis
Table 60.1 Comparison of mean nitrate concentrations [μg/m 3 ] for the Melpitz site and the corresponding correlation coefficients
Approach
March/April 2018 May–August 2018 September–November
2018
Measurements
4.62
1.46
3.51
Chen et al. [5], with
SOA coating
3.88 (0.53)
3.50 (0.21)
3.36 (0.40)
Chen et al. [5], without
SOA coating
4.09 (0.54)
3.65 (0.20)
3.60 (0.44)
(P2) in [10]
6.16 (0.50)
5.10 (0.18)
5.62 (0.49)
Without N 2 O 5
hydrolysis
3.52 (0.51)
3.22 (0.20)
2.90 (0.18)
R. Wolke et al.
60.3 Results and Discussion
The model simulations were performed for the period from March to November 2010.
The results are compared for four different parameterizations of the heterogeneous
N 2 O 5 hydrolysis: (1) Chen et al. [5] including SOA coating, (2) Chen et al. [5]
without SOA coating, (3) approach P2 of [10], (4) without N 2 O 5 hydrolysis.
The time series of the daily mean values of the nitrate concentration in Melpitz
are presented in Fig. 60.1. The corresponding statistical values are summarized in
Table 60.1. Monthly mean concentrations for Germany and some corresponding
differences for March (top) and August (below) are shown in Fig. 60.2. Usually,
COSMO-MUSCAT tends to over predict particulate nitrate in a reasonable range in
long-term average. The results were comparable with other models in previous studies [15]. In the current study, this is also the case for the periods in spring and autumn.
Nitrate [µg/m3]
Chen et al. (2018), with SOA coating
Chen et al. (2018), without SOA coating
(P2) of Riemer et al. (2003)
no N2O5 hydrolysis
measurments
Fig. 60.1 Results of COSMO-MUSCAT for the TROPOS field site Melpitz for the period from
March to November 2010: Daily impactor measurements and daily averaged model results of nitrate
for different parameterizations of the N 2 O 5 photolysis
Table 60.1 Comparison of mean nitrate concentrations [μg/m 3 ] for the Melpitz site and the corresponding correlation coefficients
Approach
March/April 2018 May–August 2018 September–November
2018
Measurements
4.62
1.46
3.51
Chen et al. [5], with
SOA coating
3.88 (0.53)
3.50 (0.21)
3.36 (0.40)
Chen et al. [5], without
SOA coating
4.09 (0.54)
3.65 (0.20)
3.60 (0.44)
(P2) in [10]
6.16 (0.50)
5.10 (0.18)
5.62 (0.49)
Without N 2 O 5
hydrolysis
3.52 (0.51)
3.22 (0.20)
2.90 (0.18)