

374
E. Karnezi et al.
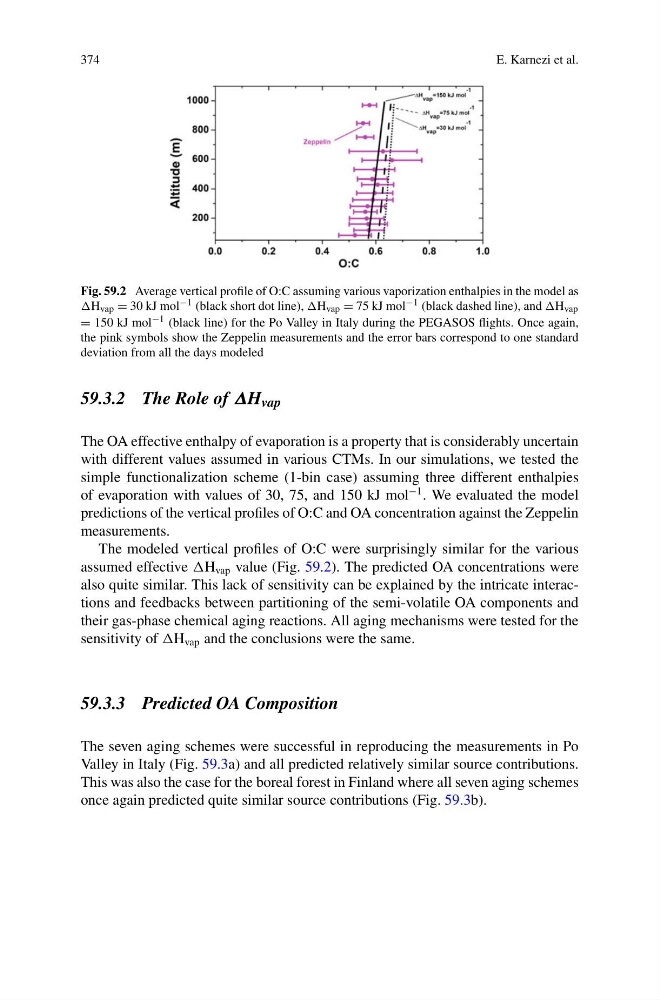
Fig. 59.2 Average vertical profile of O:C assuming various vaporization enthalpies in the model as
H vap = 30 kJ mol −1 (black short dot line), H vap = 75 kJ mol −1 (black dashed line), and H vap
= 150 kJ mol −1 (black line) for the Po Valley in Italy during the PEGASOS flights. Once again,
the pink symbols show the Zeppelin measurements and the error bars correspond to one standard
deviation from all the days modeled
59.3.2 The Role of ΔH vap
The OA effective enthalpy of evaporation is a property that is considerably uncertain
with different values assumed in various CTMs. In our simulations, we tested the
simple functionalization scheme (1-bin case) assuming three different enthalpies
of evaporation with values of 30, 75, and 150 kJ mol
−1 . We evaluated the model
predictions of the vertical profiles of O:C and OA concentration against the Zeppelin
measurements.
The modeled vertical profiles of O:C were surprisingly similar for the various
assumed effective H vap value (Fig. 59.2). The predicted OA concentrations were
also quite similar. This lack of sensitivity can be explained by the intricate interactions and feedbacks between partitioning of the semi-volatile OA components and
their gas-phase chemical aging reactions. All aging mechanisms were tested for the
sensitivity of H vap and the conclusions were the same.
59.3.3 Predicted OA Composition
The seven aging schemes were successful in reproducing the measurements in Po
Valley in Italy (Fig. 59.3a) and all predicted relatively similar source contributions.
This was also the case for the boreal forest in Finland where all seven aging schemes
once again predicted quite similar source contributions (Fig. 59.3b).
E. Karnezi et al.
Fig. 59.2 Average vertical profile of O:C assuming various vaporization enthalpies in the model as
H vap = 30 kJ mol −1 (black short dot line), H vap = 75 kJ mol −1 (black dashed line), and H vap
= 150 kJ mol −1 (black line) for the Po Valley in Italy during the PEGASOS flights. Once again,
the pink symbols show the Zeppelin measurements and the error bars correspond to one standard
deviation from all the days modeled
59.3.2 The Role of ΔH vap
The OA effective enthalpy of evaporation is a property that is considerably uncertain
with different values assumed in various CTMs. In our simulations, we tested the
simple functionalization scheme (1-bin case) assuming three different enthalpies
of evaporation with values of 30, 75, and 150 kJ mol
−1 . We evaluated the model
predictions of the vertical profiles of O:C and OA concentration against the Zeppelin
measurements.
The modeled vertical profiles of O:C were surprisingly similar for the various
assumed effective H vap value (Fig. 59.2). The predicted OA concentrations were
also quite similar. This lack of sensitivity can be explained by the intricate interactions and feedbacks between partitioning of the semi-volatile OA components and
their gas-phase chemical aging reactions. All aging mechanisms were tested for the
sensitivity of H vap and the conclusions were the same.
59.3.3 Predicted OA Composition
The seven aging schemes were successful in reproducing the measurements in Po
Valley in Italy (Fig. 59.3a) and all predicted relatively similar source contributions.
This was also the case for the boreal forest in Finland where all seven aging schemes
once again predicted quite similar source contributions (Fig. 59.3b).