

360
J. Mak et al.
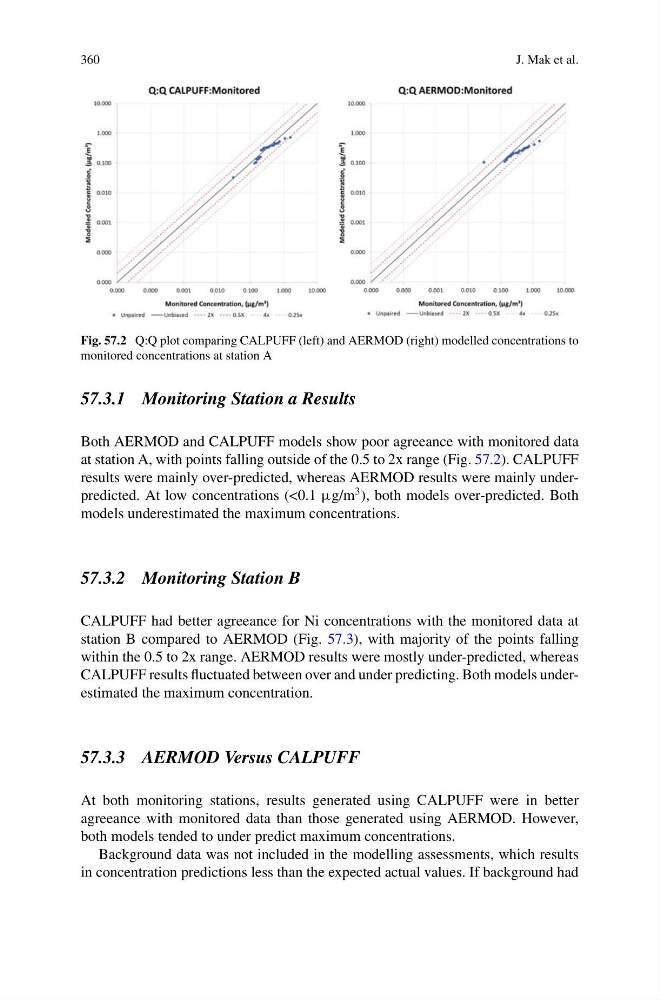
Fig. 57.2 Q:Q plot comparing CALPUFF (left) and AERMOD (right) modelled concentrations to
monitored concentrations at station A
57.3.1 Monitoring Station a Results
Both AERMOD and CALPUFF models show poor agreeance with monitored data
at station A, with points falling outside of the 0.5 to 2x range (Fig. 57.2). CALPUFF
results were mainly over-predicted, whereas AERMOD results were mainly underpredicted. At low concentrations (<0.1 µg/m
3 ), both models over-predicted. Both
models underestimated the maximum concentrations.
57.3.2 Monitoring Station B
CALPUFF had better agreeance for Ni concentrations with the monitored data at
station B compared to AERMOD (Fig. 57.3), with majority of the points falling
within the 0.5 to 2x range. AERMOD results were mostly under-predicted, whereas
CALPUFF results fluctuated between over and under predicting. Both models underestimated the maximum concentration.
57.3.3 AERMOD Versus CALPUFF
At both monitoring stations, results generated using CALPUFF were in better
agreeance with monitored data than those generated using AERMOD. However,
both models tended to under predict maximum concentrations.
Background data was not included in the modelling assessments, which results
in concentration predictions less than the expected actual values. If background had
J. Mak et al.
Fig. 57.2 Q:Q plot comparing CALPUFF (left) and AERMOD (right) modelled concentrations to
monitored concentrations at station A
57.3.1 Monitoring Station a Results
Both AERMOD and CALPUFF models show poor agreeance with monitored data
at station A, with points falling outside of the 0.5 to 2x range (Fig. 57.2). CALPUFF
results were mainly over-predicted, whereas AERMOD results were mainly underpredicted. At low concentrations (<0.1 µg/m
3 ), both models over-predicted. Both
models underestimated the maximum concentrations.
57.3.2 Monitoring Station B
CALPUFF had better agreeance for Ni concentrations with the monitored data at
station B compared to AERMOD (Fig. 57.3), with majority of the points falling
within the 0.5 to 2x range. AERMOD results were mostly under-predicted, whereas
CALPUFF results fluctuated between over and under predicting. Both models underestimated the maximum concentration.
57.3.3 AERMOD Versus CALPUFF
At both monitoring stations, results generated using CALPUFF were in better
agreeance with monitored data than those generated using AERMOD. However,
both models tended to under predict maximum concentrations.
Background data was not included in the modelling assessments, which results
in concentration predictions less than the expected actual values. If background had