

57 Comparison of the Performance of AERMOD …
359
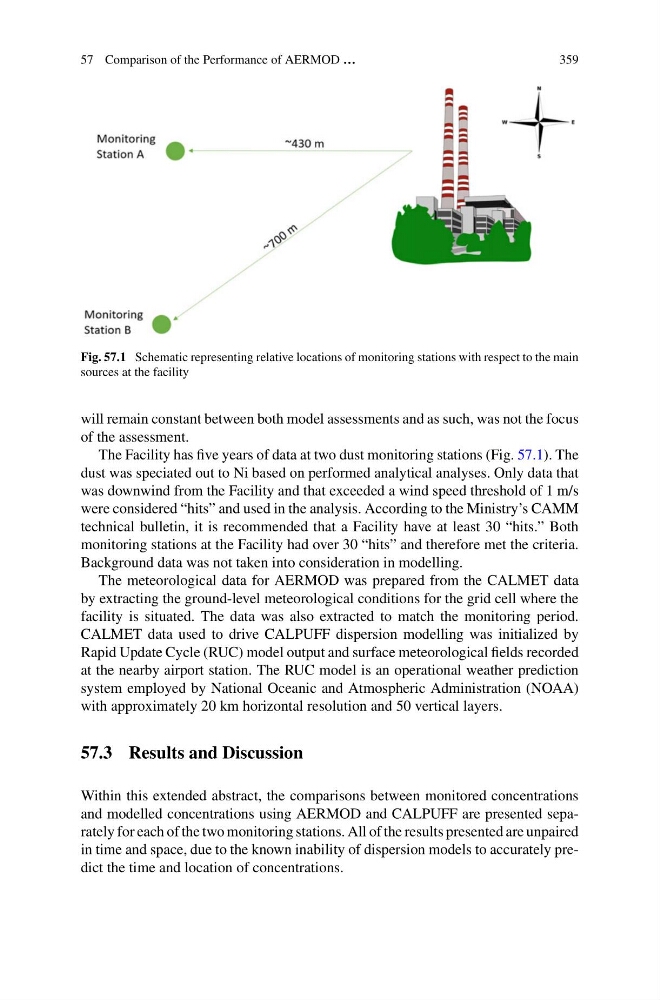
Fig. 57.1 Schematic representing relative locations of monitoring stations with respect to the main
sources at the facility
will remain constant between both model assessments and as such, was not the focus
of the assessment.
The Facility has five years of data at two dust monitoring stations (Fig. 57.1). The
dust was speciated out to Ni based on performed analytical analyses. Only data that
was downwind from the Facility and that exceeded a wind speed threshold of 1 m/s
were considered “hits” and used in the analysis. According to the Ministry’s CAMM
technical bulletin, it is recommended that a Facility have at least 30 “hits.” Both
monitoring stations at the Facility had over 30 “hits” and therefore met the criteria.
Background data was not taken into consideration in modelling.
The meteorological data for AERMOD was prepared from the CALMET data
by extracting the ground-level meteorological conditions for the grid cell where the
facility is situated. The data was also extracted to match the monitoring period.
CALMET data used to drive CALPUFF dispersion modelling was initialized by
Rapid Update Cycle (RUC) model output and surface meteorological fields recorded
at the nearby airport station. The RUC model is an operational weather prediction
system employed by National Oceanic and Atmospheric Administration (NOAA)
with approximately 20 km horizontal resolution and 50 vertical layers.
57.3 Results and Discussion
Within this extended abstract, the comparisons between monitored concentrations
and modelled concentrations using AERMOD and CALPUFF are presented separately for each of the two monitoring stations. All of the results presented are unpaired
in time and space, due to the known inability of dispersion models to accurately predict the time and location of concentrations.
359
Fig. 57.1 Schematic representing relative locations of monitoring stations with respect to the main
sources at the facility
will remain constant between both model assessments and as such, was not the focus
of the assessment.
The Facility has five years of data at two dust monitoring stations (Fig. 57.1). The
dust was speciated out to Ni based on performed analytical analyses. Only data that
was downwind from the Facility and that exceeded a wind speed threshold of 1 m/s
were considered “hits” and used in the analysis. According to the Ministry’s CAMM
technical bulletin, it is recommended that a Facility have at least 30 “hits.” Both
monitoring stations at the Facility had over 30 “hits” and therefore met the criteria.
Background data was not taken into consideration in modelling.
The meteorological data for AERMOD was prepared from the CALMET data
by extracting the ground-level meteorological conditions for the grid cell where the
facility is situated. The data was also extracted to match the monitoring period.
CALMET data used to drive CALPUFF dispersion modelling was initialized by
Rapid Update Cycle (RUC) model output and surface meteorological fields recorded
at the nearby airport station. The RUC model is an operational weather prediction
system employed by National Oceanic and Atmospheric Administration (NOAA)
with approximately 20 km horizontal resolution and 50 vertical layers.
57.3 Results and Discussion
Within this extended abstract, the comparisons between monitored concentrations
and modelled concentrations using AERMOD and CALPUFF are presented separately for each of the two monitoring stations. All of the results presented are unpaired
in time and space, due to the known inability of dispersion models to accurately predict the time and location of concentrations.