

53 Sensitivity of Atmospheric Composition Mesoscale …
339
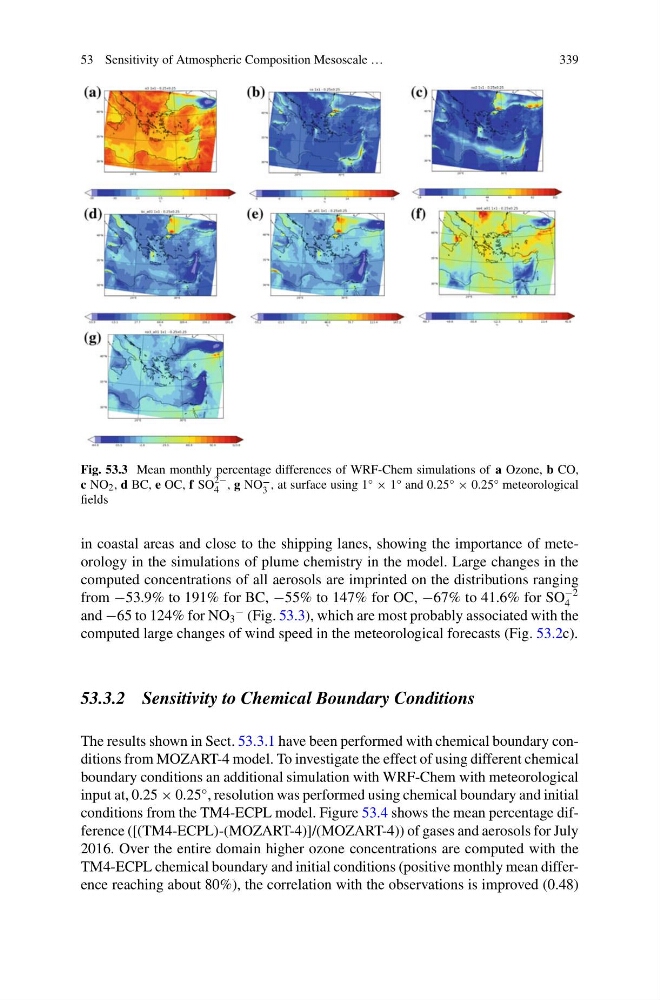
Fig. 53.3 Mean monthly percentage differences of WRF-Chem simulations of a Ozone, b CO,
c NO 2 , d BC, e OC, f SO
2−
4 , g NO −
3 , at surface using 1° × 1° and 0.25° × 0.25° meteorological
fields
in coastal areas and close to the shipping lanes, showing the importance of meteorology in the simulations of plume chemistry in the model. Large changes in the
computed concentrations of all aerosols are imprinted on the distributions ranging
from −53.9% to 191% for BC, −55% to 147% for OC, −67% to 41.6% for SO
−2
4
and −65 to 124% for NO 3
− (Fig. 53.3), which are most probably associated with the
computed large changes of wind speed in the meteorological forecasts (Fig. 53.2c).
53.3.2 Sensitivity to Chemical Boundary Conditions
The results shown in Sect. 53.3.1 have been performed with chemical boundary conditions from MOZART-4 model. To investigate the effect of using different chemical
boundary conditions an additional simulation with WRF-Chem with meteorological
input at, 0.25 × 0.25°, resolution was performed using chemical boundary and initial
conditions from the TM4-ECPL model. Figure 53.4 shows the mean percentage difference ([(TM4-ECPL)-(MOZART-4)]/(MOZART-4)) of gases and aerosols for July
2016. Over the entire domain higher ozone concentrations are computed with the
TM4-ECPL chemical boundary and initial conditions (positive monthly mean difference reaching about 80%), the correlation with the observations is improved (0.48)
339
Fig. 53.3 Mean monthly percentage differences of WRF-Chem simulations of a Ozone, b CO,
c NO 2 , d BC, e OC, f SO
2−
4 , g NO −
3 , at surface using 1° × 1° and 0.25° × 0.25° meteorological
fields
in coastal areas and close to the shipping lanes, showing the importance of meteorology in the simulations of plume chemistry in the model. Large changes in the
computed concentrations of all aerosols are imprinted on the distributions ranging
from −53.9% to 191% for BC, −55% to 147% for OC, −67% to 41.6% for SO
−2
4
and −65 to 124% for NO 3
− (Fig. 53.3), which are most probably associated with the
computed large changes of wind speed in the meteorological forecasts (Fig. 53.2c).
53.3.2 Sensitivity to Chemical Boundary Conditions
The results shown in Sect. 53.3.1 have been performed with chemical boundary conditions from MOZART-4 model. To investigate the effect of using different chemical
boundary conditions an additional simulation with WRF-Chem with meteorological
input at, 0.25 × 0.25°, resolution was performed using chemical boundary and initial
conditions from the TM4-ECPL model. Figure 53.4 shows the mean percentage difference ([(TM4-ECPL)-(MOZART-4)]/(MOZART-4)) of gases and aerosols for July
2016. Over the entire domain higher ozone concentrations are computed with the
TM4-ECPL chemical boundary and initial conditions (positive monthly mean difference reaching about 80%), the correlation with the observations is improved (0.48)