

338
D. G. Amanatidis et al.
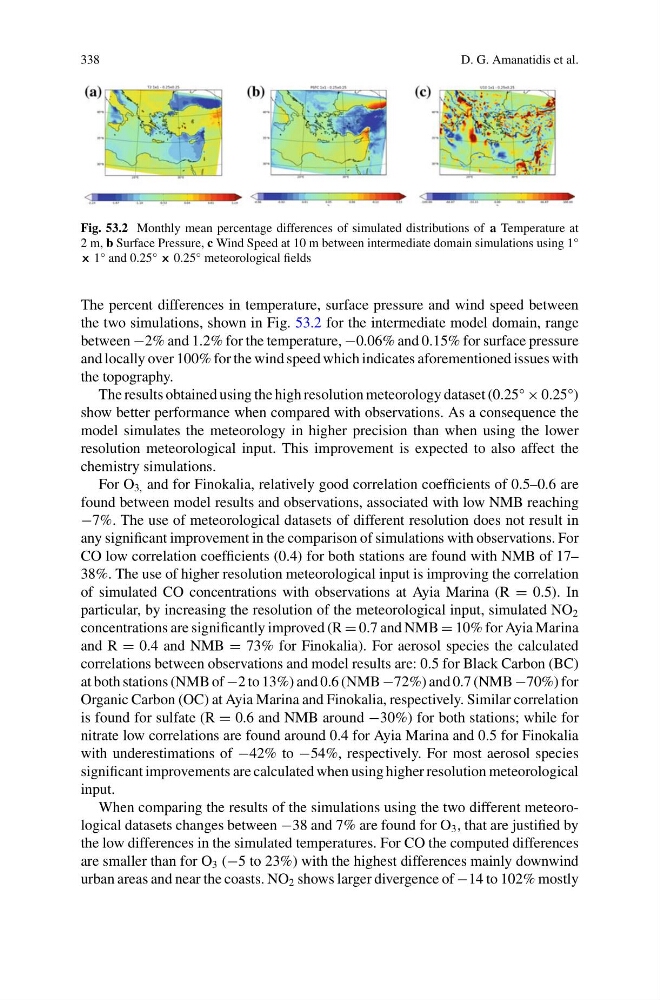
Fig. 53.2 Monthly mean percentage differences of simulated distributions of a Temperature at
2 m, b Surface Pressure, c Wind Speed at 10 m between intermediate domain simulations using 1°
× 1° and 0.25° × 0.25° meteorological fields
The percent differences in temperature, surface pressure and wind speed between
the two simulations, shown in Fig. 53.2 for the intermediate model domain, range
between −2% and 1.2% for the temperature, −0.06% and 0.15% for surface pressure
and locally over 100% for the wind speed which indicates aforementioned issues with
the topography.
The results obtained using the high resolution meteorology dataset (0.25° × 0.25°)
show better performance when compared with observations. As a consequence the
model simulates the meteorology in higher precision than when using the lower
resolution meteorological input. This improvement is expected to also affect the
chemistry simulations.
For O 3, and for Finokalia, relatively good correlation coefficients of 0.5–0.6 are
found between model results and observations, associated with low NMB reaching
−7%. The use of meteorological datasets of different resolution does not result in
any significant improvement in the comparison of simulations with observations. For
CO low correlation coefficients (0.4) for both stations are found with NMB of 17–
38%. The use of higher resolution meteorological input is improving the correlation
of simulated CO concentrations with observations at Ayia Marina (R = 0.5). In
particular, by increasing the resolution of the meteorological input, simulated NO 2
concentrations are significantly improved (R = 0.7 and NMB = 10% for Ayia Marina
and R = 0.4 and NMB = 73% for Finokalia). For aerosol species the calculated
correlations between observations and model results are: 0.5 for Black Carbon (BC)
at both stations (NMB of −2 to 13%) and 0.6 (NMB −72%) and 0.7 (NMB −70%) for
Organic Carbon (OC) at Ayia Marina and Finokalia, respectively. Similar correlation
is found for sulfate (R = 0.6 and NMB around −30%) for both stations; while for
nitrate low correlations are found around 0.4 for Ayia Marina and 0.5 for Finokalia
with underestimations of −42% to −54%, respectively. For most aerosol species
significant improvements are calculated when using higher resolution meteorological
input.
When comparing the results of the simulations using the two different meteorological datasets changes between −38 and 7% are found for O 3 , that are justified by
the low differences in the simulated temperatures. For CO the computed differences
are smaller than for O 3 (−5 to 23%) with the highest differences mainly downwind
urban areas and near the coasts. NO 2 shows larger divergence of −14 to 102% mostly
D. G. Amanatidis et al.
Fig. 53.2 Monthly mean percentage differences of simulated distributions of a Temperature at
2 m, b Surface Pressure, c Wind Speed at 10 m between intermediate domain simulations using 1°
× 1° and 0.25° × 0.25° meteorological fields
The percent differences in temperature, surface pressure and wind speed between
the two simulations, shown in Fig. 53.2 for the intermediate model domain, range
between −2% and 1.2% for the temperature, −0.06% and 0.15% for surface pressure
and locally over 100% for the wind speed which indicates aforementioned issues with
the topography.
The results obtained using the high resolution meteorology dataset (0.25° × 0.25°)
show better performance when compared with observations. As a consequence the
model simulates the meteorology in higher precision than when using the lower
resolution meteorological input. This improvement is expected to also affect the
chemistry simulations.
For O 3, and for Finokalia, relatively good correlation coefficients of 0.5–0.6 are
found between model results and observations, associated with low NMB reaching
−7%. The use of meteorological datasets of different resolution does not result in
any significant improvement in the comparison of simulations with observations. For
CO low correlation coefficients (0.4) for both stations are found with NMB of 17–
38%. The use of higher resolution meteorological input is improving the correlation
of simulated CO concentrations with observations at Ayia Marina (R = 0.5). In
particular, by increasing the resolution of the meteorological input, simulated NO 2
concentrations are significantly improved (R = 0.7 and NMB = 10% for Ayia Marina
and R = 0.4 and NMB = 73% for Finokalia). For aerosol species the calculated
correlations between observations and model results are: 0.5 for Black Carbon (BC)
at both stations (NMB of −2 to 13%) and 0.6 (NMB −72%) and 0.7 (NMB −70%) for
Organic Carbon (OC) at Ayia Marina and Finokalia, respectively. Similar correlation
is found for sulfate (R = 0.6 and NMB around −30%) for both stations; while for
nitrate low correlations are found around 0.4 for Ayia Marina and 0.5 for Finokalia
with underestimations of −42% to −54%, respectively. For most aerosol species
significant improvements are calculated when using higher resolution meteorological
input.
When comparing the results of the simulations using the two different meteorological datasets changes between −38 and 7% are found for O 3 , that are justified by
the low differences in the simulated temperatures. For CO the computed differences
are smaller than for O 3 (−5 to 23%) with the highest differences mainly downwind
urban areas and near the coasts. NO 2 shows larger divergence of −14 to 102% mostly