

49 Multi Model Study on the Impact of Emissions on CTMs
311
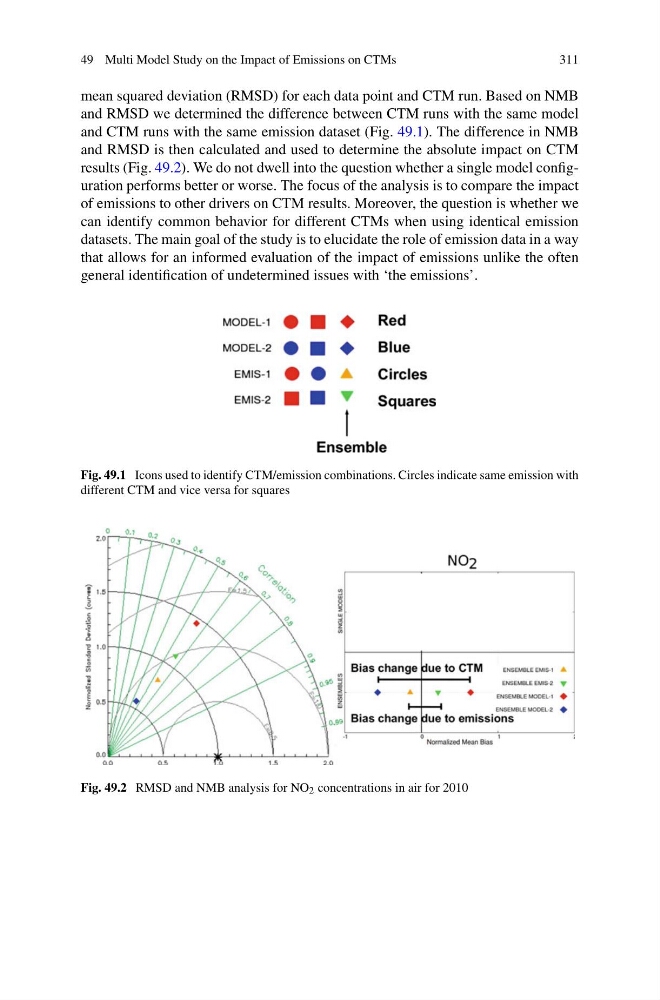
mean squared deviation (RMSD) for each data point and CTM run. Based on NMB
and RMSD we determined the difference between CTM runs with the same model
and CTM runs with the same emission dataset (Fig. 49.1). The difference in NMB
and RMSD is then calculated and used to determine the absolute impact on CTM
results (Fig. 49.2). We do not dwell into the question whether a single model configuration performs better or worse. The focus of the analysis is to compare the impact
of emissions to other drivers on CTM results. Moreover, the question is whether we
can identify common behavior for different CTMs when using identical emission
datasets. The main goal of the study is to elucidate the role of emission data in a way
that allows for an informed evaluation of the impact of emissions unlike the often
general identification of undetermined issues with ‘the emissions’.
Fig. 49.1 Icons used to identify CTM/emission combinations. Circles indicate same emission with
different CTM and vice versa for squares
Fig. 49.2 RMSD and NMB analysis for NO 2 concentrations in air for 2010
311
mean squared deviation (RMSD) for each data point and CTM run. Based on NMB
and RMSD we determined the difference between CTM runs with the same model
and CTM runs with the same emission dataset (Fig. 49.1). The difference in NMB
and RMSD is then calculated and used to determine the absolute impact on CTM
results (Fig. 49.2). We do not dwell into the question whether a single model configuration performs better or worse. The focus of the analysis is to compare the impact
of emissions to other drivers on CTM results. Moreover, the question is whether we
can identify common behavior for different CTMs when using identical emission
datasets. The main goal of the study is to elucidate the role of emission data in a way
that allows for an informed evaluation of the impact of emissions unlike the often
general identification of undetermined issues with ‘the emissions’.
Fig. 49.1 Icons used to identify CTM/emission combinations. Circles indicate same emission with
different CTM and vice versa for squares
Fig. 49.2 RMSD and NMB analysis for NO 2 concentrations in air for 2010