

310
J. Bieser et al.
49.2 Methodology
This study is based on regional European CTM results from the Air Quality Modeling
Evaluation International Initiative (AQMEII3) [1], Solazzo and Galmarini [9]. In the
course of AQMEII3, input data for the regional CTMs were harmonized in a way that
allows for the investigation of the impact of the various CTMs. Based on identical
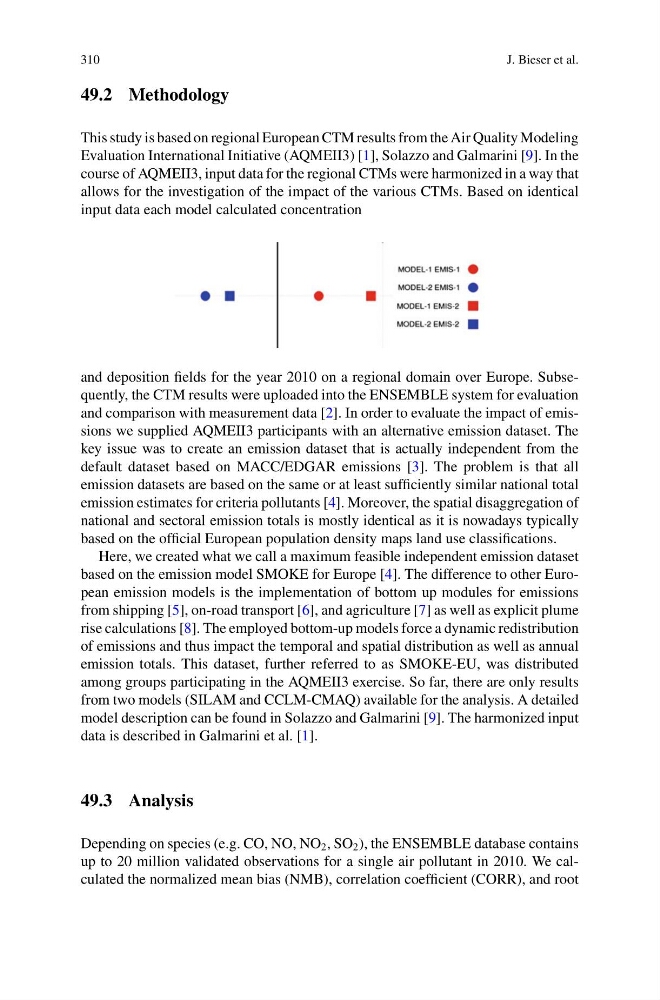
input data each model calculated concentration
and deposition fields for the year 2010 on a regional domain over Europe. Subsequently, the CTM results were uploaded into the ENSEMBLE system for evaluation
and comparison with measurement data [2]. In order to evaluate the impact of emissions we supplied AQMEII3 participants with an alternative emission dataset. The
key issue was to create an emission dataset that is actually independent from the
default dataset based on MACC/EDGAR emissions [3]. The problem is that all
emission datasets are based on the same or at least sufficiently similar national total
emission estimates for criteria pollutants [4]. Moreover, the spatial disaggregation of
national and sectoral emission totals is mostly identical as it is nowadays typically
based on the official European population density maps land use classifications.
Here, we created what we call a maximum feasible independent emission dataset
based on the emission model SMOKE for Europe [4]. The difference to other European emission models is the implementation of bottom up modules for emissions
from shipping [5], on-road transport [6], and agriculture [7] as well as explicit plume
rise calculations [8]. The employed bottom-up models force a dynamic redistribution
of emissions and thus impact the temporal and spatial distribution as well as annual
emission totals. This dataset, further referred to as SMOKE-EU, was distributed
among groups participating in the AQMEII3 exercise. So far, there are only results
from two models (SILAM and CCLM-CMAQ) available for the analysis. A detailed
model description can be found in Solazzo and Galmarini [9]. The harmonized input
data is described in Galmarini et al. [1].
49.3 Analysis
Depending on species (e.g. CO, NO, NO 2 , SO 2 ), the ENSEMBLE database contains
up to 20 million validated observations for a single air pollutant in 2010. We calculated the normalized mean bias (NMB), correlation coefficient (CORR), and root
J. Bieser et al.
49.2 Methodology
This study is based on regional European CTM results from the Air Quality Modeling
Evaluation International Initiative (AQMEII3) [1], Solazzo and Galmarini [9]. In the
course of AQMEII3, input data for the regional CTMs were harmonized in a way that
allows for the investigation of the impact of the various CTMs. Based on identical
input data each model calculated concentration
and deposition fields for the year 2010 on a regional domain over Europe. Subsequently, the CTM results were uploaded into the ENSEMBLE system for evaluation
and comparison with measurement data [2]. In order to evaluate the impact of emissions we supplied AQMEII3 participants with an alternative emission dataset. The
key issue was to create an emission dataset that is actually independent from the
default dataset based on MACC/EDGAR emissions [3]. The problem is that all
emission datasets are based on the same or at least sufficiently similar national total
emission estimates for criteria pollutants [4]. Moreover, the spatial disaggregation of
national and sectoral emission totals is mostly identical as it is nowadays typically
based on the official European population density maps land use classifications.
Here, we created what we call a maximum feasible independent emission dataset
based on the emission model SMOKE for Europe [4]. The difference to other European emission models is the implementation of bottom up modules for emissions
from shipping [5], on-road transport [6], and agriculture [7] as well as explicit plume
rise calculations [8]. The employed bottom-up models force a dynamic redistribution
of emissions and thus impact the temporal and spatial distribution as well as annual
emission totals. This dataset, further referred to as SMOKE-EU, was distributed
among groups participating in the AQMEII3 exercise. So far, there are only results
from two models (SILAM and CCLM-CMAQ) available for the analysis. A detailed
model description can be found in Solazzo and Galmarini [9]. The harmonized input
data is described in Galmarini et al. [1].
49.3 Analysis
Depending on species (e.g. CO, NO, NO 2 , SO 2 ), the ENSEMBLE database contains
up to 20 million validated observations for a single air pollutant in 2010. We calculated the normalized mean bias (NMB), correlation coefficient (CORR), and root